Understanding the Difference between Quantitative and Qualitative Data

This article explains the difference between quantitative and qualitative data. Qualitative data are described in words and based on the quality of an observation, such as color, odor, or texture
- Uploaded on | 3 Views
-
 lilyparker
About Understanding the Difference between Quantitative and Qualitative Data
PowerPoint presentation about 'Understanding the Difference between Quantitative and Qualitative Data'. This presentation describes the topic on This article explains the difference between quantitative and qualitative data. Qualitative data are described in words and based on the quality of an observation, such as color, odor, or texture. The key topics included in this slideshow are . Download this presentation absolutely free.
Presentation Transcript
Slide1Quantitative vs. qualitative data
Slide2Qualitative Data Qualitative Data: Qualitative data are descriptions in words of what is being observed. They are based on some quality of an observation, such as color, odor, or texture. * Notice the qualitative data are descriptions.
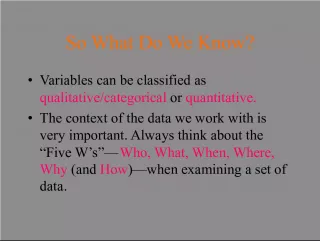
Slide3Quantitative Data Quantitative Data: Quantitative data are numeric measurements. The data are objective- they are the same no matter who measures them. They include measurements such as mass, volume, temperature, distance, concentration, time, or frequency. The quantitative data are objective, numerical measurements
Slide4Example Suppose a marine biologist observes the behavior and activities of dolphins. She identifies different dolphins within the group and observes them every day for a month. She records detailed observations about their behaviors. Some of her observations are qualitative data and some are quantitative data. Qualitative data examples Dolphin colors range from gray to white. Dolphins in a pod engage in play behavior. Dolphins have smooth skin. Quantitative data examples There are nine dolphins in this pod. Dolphins eat the equivalent of 4-5% of their body mass each day. The sonar frequency most often used by the dolphins is around 100kHz.
Slide5Identify Data Types Suppose that you are a biologist studying elephants in their natural habitat in Africa. You observe their behaviors and interaction, and take photographs of their interactions to study later. Examine the photograph of the elephants shown above. Analyze Give two examples of qualitative data that could be obtained from the photograph of the elephants. Analyze Give two examples of quantitative data that could be obtained from the photograph of the elephants.