Modeling and Simulation for Navy Manpower Requirements Analysis: Present and Future

This briefing provides an overview of the benefits of using modeling and simulation to forecast manpower requirements for the US Navy. It presents three available technologies for immediate incorporation and discusses future developments to augment the Navy Manpower Requirements System (NMRS).
- Uploaded on | 0 Views
-
 sosefina
About Modeling and Simulation for Navy Manpower Requirements Analysis: Present and Future
PowerPoint presentation about 'Modeling and Simulation for Navy Manpower Requirements Analysis: Present and Future'. This presentation describes the topic on This briefing provides an overview of the benefits of using modeling and simulation to forecast manpower requirements for the US Navy. It presents three available technologies for immediate incorporation and discusses future developments to augment the Navy Manpower Requirements System (NMRS).. The key topics included in this slideshow are modeling, simulation, manpower requirements, US Navy, NMRS,. Download this presentation absolutely free.
Presentation Transcript
1. Modeling Tools to Support Navy Manpower Requirements Analysis Briefing to RADM Harvey 4 September 2002
2. 2 Objectives of the Briefing Provide background on the use of modeling and simulation to forecast manpower requirements Present the advantages of manpower modeling approach over traditional approaches to manpower requirements Present three immediately available technologies that could be incorporated Discuss future development of modeling and simulation to augment NMRS
3. 3 Background on Modeling and Simulation for Manpower Requirements Analysis Industry has used modeling and simulation to evaluate manpower needs for several decades DoD began developing methods for modeling human systems in the 1970s Army MANPRINT program adopted modeling and simulation-based tools for determining operational manpower requirements in late 1980s/early 1990s Accredited modeling as a basis for manpower requirements analysis during design in 1995 Navy began research in the use of modeling for manpower analysis in the 1990s
4. 4 Background on Modeling and Simulation for Manpower Requirements Analysis DD 21/(X) changed the landscape of the systems engineering process with respect to manpower modeling in the DoD Manpower was a KPP Manpower issues had to be tied to operational consequences DD 21/(X) was an SBA (simulation-based acquisition) DD 21/(X) was a revolutionary system, so old approaches (e.g., HARDMAN) would not work Forecasting manpower requirements accurately, tracking them to system performance requirements, and doing it on a sound engineering basis was a necessity!
5. 5 Background on Modeling and Simulation for Manpower Requirements Analysis The manpower modeling ideas and technology from DD 21/(X) matured during several Navy R&D efforts ONR Manning Affordability Initiative Watchstander Model SEAIT/SMART3 Total Crew Model The ideas and technology became a part of the systems engineering toolkit for other programs Coast Guard Deepwater JCC(X) AEGIS Open Architecture TSI approach to modernization
6. 6 Advantages of Modeling and Simulation for Manpower Requirements Determination Full traceability between mission and manpower requirements If we man to this level, we can expect this mission performance Considers and evaluates the peaks and valleys of the need for manpower Straightforward ways to trade between at-sea and in-port workload concepts Transparent and understandable Ability to trace manpower-induced problems to the source, and identify the impact of possible solutions A solid link to systems engineering and design Tools are available, mature, and low cost or free Significant validation has already been conducted
7. 7 Mission duration Number required What Many Manpower Models Assume
8. 8 What Drives Manpower and Ship Performance Mission duration Number required
9. 9 Advantages of Modeling and Simulation for Manpower Requirements Determination Full traceability between mission and manpower requirements If we man to this level, we can expect this mission performance Considers and evaluates the peaks and valleys of the need for manpower Straightforward ways to understand at-sea and in-port workload Transparent and understandable Ability to trace manpower-induced problems to the source, and identify the impact of possible solutions A solid link to systems engineering and design Tools are available, mature, and low cost or free Significant validation has already been conducted
10. 10 Proposed Improvements Complement existing NMRS algorithms / calculations data Strengthen the PSMD development process Provide meaningful trade space analysis for the acquisition process Ensure : CONSISTENTLY Apply Navy Manpower and personnel policies Apply uniform parameters and allowances Combine Watch and Workload data UNIFORMLY Translate workload drivers Optimize requirements within specified boundaries Determine minimum skill and quality Reflects: Scenario based wartime and peacetime missions Warfare sponsor requirements (ROC/POE)
11. 11 Objectives of Manpower Modeling Provide quantitative metrics in a controlled simulation to support system engineering and trade space analysis Support manning optimization Existing Tools Watchstander Model (WSM) Detailed watchstander operations during dynamic scenario execution Total Crew Model (TCM) Detailed crew activity and fatigue data SMART Build 3 Detailed maintenance and skill set data
12. 12 Tenets of Optimized Manning Maximize Crew Performance Identify Best operator to perform task Reduce Workload Technology Insertion Process Re-engineering Capability Change Re-allocate from sea to shore Reduced Workload Does not Equate Directly to Eliminated Billets SMD Conditional Watches Collateral Duties Policy Requirements Watchstanding Corrective and Facilities Maintenance Own Unit Support Special Evolutions QoL Services Preventative Maintenance Reqd Admin Damage Control
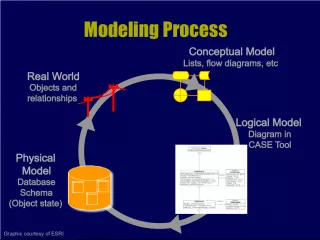
13. 13 Underlying Approach: Task Network Modeling
14. 14 Watchstander Model (Cognitive-level)
15. 15 Watchstander Model Model Explanation Micro-level, 1 second time slices Simultaneous mission execution Team definition and workload calculation System model with human as the focus Process Task analysis Build Task Flows Allocate Sailor/Auto to task Scenario Run simulation Analyze results Analysis Metrics Workload Instantaneous < 100% 3 minute running average < 95% 1 Hour running average < 80%, > 20% Goal 65% No lost mission critical tasks Previous Projects DD 21 / (X) AMO DEEPWATER FORCEnet DCPM (DC Personnel Model) RSA
16. 16 Use SME and system engineer inputs Detailed workload analysis for watchstanders. CIC Engineering Damage Control Bridge Food Service Design tool for CS engineers. Tests multiple design variants before committing. Evaluates mission simultaneity Provides empirical data identifying the relationships between track density and crew workload. Watchstander Model
17. 17 Demo
18. 18 Total Crew Model
19. 19 Total Crew Model Rapid trade space analysis through optimization of relevant outcomes asking What if questions Ship capabilities (can the crew perform all evolutions?) Evaluate impact of system design changes on crew workload Evaluate impact of ships schedule on crew fatigue Evaluate resource availability on mission success Target limited resources for best results Training requirements for billets Quality of life issues Personal time, work hours and type of work, sleep, meals
20. 20 Total Crew Model Model Explanation Macro-level, 15 minute time slices Simultaneous event execution Crew workload versus Navy staffing standards Test crew size against mission execution DDG 85 baseline WQ&SB & ship class SMD working papers Process Define evolutions/events Define priority matrix Build task flow Assign sailors to evolutions Randomize special events Run simulation Analyze results Analysis Metrics Ships schedule Mission accomplishment Crew activity data Sleep = 8 hrs/day Personal Time = 2.5 hrs/day Meals = 1.5 hrs/day Work = 12 hrs/day 81 hours weekly Fatigue Previous Projects DEEPWATER DD21 / (X) FORCEnet DCPM
21. 21 Crew Weekly Workload Summary Billet No. Billet Title Rank/ Rate Primary CP SD Spec EV Trg Totals 0101 W/S-1 LT 54 0.9 15.9 0 10 80.7 Billet No. Primary 0101 Watch Planning 42 12 Cleaning & Preservation Personal Public CO/XO 0.9 0 0 Secondary Duties Pers Mgmt Cts/Bds/Mtg Qtrs/Assy 7.6 7.8 0.5 Training Formal PFT 7 3 HSI Models Static Model, Preliminary Ship Manpower Document Workload = FM+OM+PM+CM+OUS+PA+SD+TR = 81hrs/week PSMD Worksheet Traces Each Billet Back to Workload Components Zero-based Manning Assignments - Every Sailor has a specified reason for being a part of the crew Detailed Documentation For DD21 the Manpower Analysis Report For DDG 79 the NAVMAC Working Papers
22. 22 Total Crew Model Components Daily Routine Watchstanders Maintainers Food Service Admin Schedules depend on current readiness condition. Crew Assignments (WQ&SB) Assignment of billets to evolutions. (Resources sheet) Rules defining personnel requirements for evolutions. (Logic sheet) Trump Matrix Contains all possible pair wise comparisons for task priorities. Scenario Normal routine and authored recurring and infrequent evolutions. Usually > 10 days to ensure compounded fatigue is captured.
23. 23 Modeled as series of task networks Each crewmember belongs to a home network Evolutions are scheduled in the model event queue to occur at a scripted times Evolutions use the WQ&SB and the trump matrix to select crew members Daily Routine Daily Routine Watch Sections 1, 2, & 3 Day Schedules Daily Routine & Evolution Scheduling Scripted Evolution Schedule Scripted Evolution Schedule
24. 24 Crew members are designated for each evolution Specific rules are given for selecting from several crew members Each evolution & routine schedule event is compared to each other evolution for prioritization A trumping evolution must trump all scheduled tasks for crew member for the duration of the evolution Sailor Assignment & Trump Matrix WQ&SB WQ&SB Choose most rested HCO Choose most rested HCO Choose most rested LSO Choose most rested LSO Trumping Task Evolution Priority Matrix Evolution Priority Matrix
25. 25 Fatigue Degradation Equation Circadian Component Circadian Component Combined Degradation Combined Degradation Linear Awake Degradation & Parabolic Sleep Recovery Linear Awake Degradation & Parabolic Sleep Recovery Awake Asleep Asleep
26. 26 Work Personal Needs Sleep Total Crew Model Output Examples: Fatigue & Total Hours Breakdown Exhausted Normal Micro sleep begins ~ 9 Micro sleep increases in duration & frequency as fatigue climbs
27. 27 Evolution Delays/Failures Total Crew Model Mission Data Successful Evolutions
28. 28 TCM Validation Effort Phase I (to be conducted onboard USS Milius) Navys current optimal manning experiment (OME) DDG Test actual data against model predicted data Mission schedule Mission effectiveness Crew assignments Crew fatigue Phase II (to be conducted a non-experimental ship) For further validation Control
29. 29 SMART B3 Model Model Explanation PM, CM Based on equipment usage FM, OUS Scheduled (can be deferred) Stochastic Operational Functions/Tasks Function Task Skill Requirements Job (Rank/Rating) skills and abilities Process Define System Parameters (Equipment, Compartments, Maintenance Actions) Scenario Development (GANTT Charting feature) Function/Task analysis Build Task Flows Allocate job/auto to tasks Run simulation/Analyze results Analysis Metrics Skill Usage (average and over time) Crew Requirement Utilization (average and over time) Operational and Directed Manhour Requirements Maintenance Hit Matrix Personnel Conflicts Crew Composition Cost Data Navy Projects Currently being integrated with Manpower Analysis and Prediction System (MAPS) Navy owned
30. 30 Operational & Maintenance manpower Focus on skills needed to perform tasks Requirements based Driven from the bottom-up Assigned to jobs Apply iterative, what-if analytical approach SMART Build 3 Features
31. 31 SMART B3 Challenge BEST What is the BEST crew composition for a new system? Skills Size Cost Complications Early answers required Fast turn-around required Range of missions and environments Minimize cost Minimize crew size Minimize number of different jobs Minimize workload
32. 32 Building SMART B3 The Pieces Ship Manpower Analysis and Requirement Tools (SMART) Ship Manpower Analysis and Requirement Tools (SMART) Working Together Human Performance Modeling Human Performance Modeling Skill and Ability Taxonomy Skill and Ability Taxonomy To Evaluate New Acquisitions and Evolving Manning Concepts for Legacy Ships Existing Manpower Ship Data & Maintenance Models Existing Manpower Ship Data & Maintenance Models
33. 33 SMART B3 Skill Taxonomy Based on taxonomy work by Edwin A. Fleishman 50 different skills and abilities grouped into 8 different categories Scales anchored with behavioral examples Communication Visual Auditory Conceptual Speed-Loaded Reasoning Fine Motor Gross Motor
34. 34 COMET Cost Data PMS Preventive Maintenance Data SMD Directed Manpower FMWAP Facilities Maintenance JASS KSA Data MAPS Watch Station & High Driver Man-hour Requirements
35. 35 Sample Build 3 Results Overall skill usage By run & job 8 Major Categories Skill usage over time View selected skills/abilities (1-4) for any one job Crew Requirement Comparison of number personnel used to number available Utilization Total & Over Time by Job
36. 36 Model Summary Watchstander Model Micro-level design tool. Detailed workload analysis for watchstanders. Tests multiple design variants before committing. Provides empirical data on low level task and function performance. Total Crew Model Macro-level design tool. High-level workload and crew activity analysis for entire ships crew. Considers fatigue and crew resiliency/performance. Identifies manpower resource drivers. Provides empirical data identifying the relationships between manpower, scenarios, and performance. SMART B3 Focus on mixing the jobs that the crew does to optimize different aspects of ship manning. Includes sophisticated maintenance modeling capability.
37. 37 Model Interactions TCM WSM SMART3 jobs billets? task performance reallocate tasks
38. 38 Modeling & Methodology Result Influences Total Ownership Cost Technology/ Innovation Effect on Functions Crew Hypothesis: # & Skill Mix Development $ Procurement $ Installation $ Maintenance Labor Spares, etc. Other TSIT Analysis Total Ownership Cost RDT&E Acquisition Life Cycle Operations & Support Design and Construction Indirect Manpower Other Personnel/ Infrastructure Personnel $ Training $ Manpower Modeling and Associated Analysis Number of Crew Skill Rqmt Etc.
39. 39 Advantages of Modeling and Simulation for Manpower Requirements Determination Full traceability between mission and manpower requirements If we man to this level, we can expect this mission performance Considers and evaluates the peaks and valleys of the need for manpower Straightforward ways to trade between at-sea and in- port workload concepts Transparent and understandable Ability to trace manpower-induced problems to the source, and identify the impact of possible solutions A solid link to systems engineering and design Tools are available and mature Significant validation has already been conducted