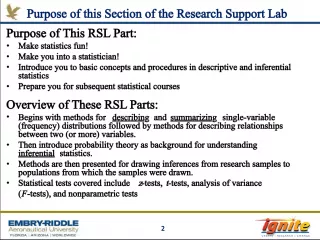
Statistics for the Social Sciences: Using t tests

This course, Psychology 340, focuses on the application of statistical analysis in the social sciences. In this particular lecture series, the topic of t tests will be explored. The outline
- Uploaded on | 3 Views
-
 tristanthomsen
About Statistics for the Social Sciences: Using t tests
PowerPoint presentation about 'Statistics for the Social Sciences: Using t tests'. This presentation describes the topic on This course, Psychology 340, focuses on the application of statistical analysis in the social sciences. In this particular lecture series, the topic of t tests will be explored. The outline. The key topics included in this slideshow are . Download this presentation absolutely free.
Presentation Transcript
Slide1Statistics for the Social SciencesPsychology 340 Fall 2006 Using t-tests
Slide2Statistics for theSocial Sciences Outline (for next 3 lectures) • Review t-tests – One sample, related samples, independent samples – Additional assumptions • Levene’s test
Slide3Statistics for theSocial Sciences Statistical analysis follows design • The one-sample z-test can be used when: – 1 sample – One score per subject – Population mean ( ) and standard deviation ( )are known
Slide4Statistics for theSocial Sciences Statistical analysis follows design • The one-sample t-test can be used when: – 1 sample – One score per subject – Population mean ( ) is known – but standard deviation ( ) is NOT known
Slide5Statistics for theSocial Sciences Testing Hypotheses – Step 1 : State your hypotheses – Step 2 : Set your decision criteria – Step 3 : Collect your data – Step 4 : Compute your test statistics • Compute your estimated standard error • Compute your t-statistic • Compute your degrees of freedom – Step 5 : Make a decision about your null hypothesis • Hypothesis testing: a five step program
Slide6Statistics for theSocial Sciences Performing your statistical test • What are we doing when we test the hypotheses? – Consider a variation of our memory experiment example Population of memory patients MemoryTest is known Memory treatment Memory patients Memory Test X Compare these two means Conclusions: • the memory treatment sample are the same as those in the population of memory patients. • they aren’t the same as those in the population of memory patients H 0 : H A :
Slide7Statistics for theSocial Sciences Performing your statistical test • What are we doing when we test the hypotheses? Real world (‘truth’) H 0 : is false (is a treatment effect) Two populations X A they aren’t the same as those in the population of memory patients H 0 : is true (no treatment effect) One population X A the memory treatment sample are the same as those in the population of memory patients.
Slide8Statistics for theSocial Sciences Performing your statistical test • What are we doing when we test the hypotheses? – Computing a test statistic: Generic test Could be difference between a sample and a population, or between different samples Based on standard error or an estimate of the standard error
Slide9Statistics for theSocial Sciences Performing your statistical test Test statistic One sample z One sample t identical
Slide10Statistics for theSocial Sciences Performing your statistical test Test statistic Diff. Expected by chance Standard error One sample z One sample t different don’t know this, so need to estimate it
Slide11Statistics for theSocial Sciences Performing your statistical test Test statistic Diff. Expected by chance Standard error Estimated standard error One sample z One sample t different “ Unbiased estimate of the population standard deviation ” This is the same as the “ sample standard deviation ”
Slide12Statistics for theSocial Sciences Performing your statistical test Test statistic Diff. Expected by chance Standard error Estimated standard error One sample z One sample t different don’t know this, so need to estimate it Degrees of freedom
Slide13Statistics for theSocial Sciences One sample t-test • The t-statistic distribution (a transformation of the distribution of sample means transformed) – Varies in shape according to the degrees of freedom • New table: the t-table
Slide14Statistics for theSocial Sciences One sample t-test If test statistic is here Fail to reject H 0 Distribution of the t-statistic If test statistic is here Reject H 0 – To reject the H 0 , you want a computed test statistics that is large • The alpha level gives us the decision criterion • New table: the t-table • The t-statistic distribution (a transformation of the distribution of sample means transformed)
Slide15Statistics for theSocial Sciences One sample t-test • New table: the t-table One tailed - or - Two-tailed levels Critical values of t t crit Degrees of freedom df
Slide16Statistics for theSocial Sciences One sample t-test • What is the t crit for a two-tailed hypothesis test with a sample size of n = 6 and an -level of 0.05? Distribution of the t-statistic = 0.05 Two-tailed n = 6 df = n - 1 = 5 t crit = + 2.571
Slide17Statistics for theSocial Sciences One sample t-test Distribution of the t-statistic = 0.05 One-tailed n = 6 df = n - 1 = 5 t crit = +2.015 • What is the t crit for a one-tailed hypothesis test with a sample size of n = 6 and an -level of 0.05?
Slide18Statistics for theSocial Sciences One sample t-test An example: One sample t-test Memory experiment example: • We give a n = 16 memory patients a memory improvement treatment. • How do they compare to the general population of memory patients who have a distribution of memory errors that is Normal, = 60? • After the treatment they have an average score of = 55, s = 8 memory errors. Don’t know Do know s
Slide19Statistics for theSocial Sciences One sample t-test An example: One sample t-test Memory experiment example: • We give a n = 16 memory patients a memory improvement treatment. • How do they compare to the general population of memory patients who have a distribution of memory errors that is Normal, = 60? • After the treatment they have an average score of = 55, s = 8 memory errors. • Step 1 : State your hypotheses H 0 : the memory treatment sample are the same (or worse) as those in the population of memory patients. H A : they perform better than those in the population of memory patients Treatment > pop = 60 Treatment < pop = 60
Slide20Statistics for theSocial Sciences One sample t-test Memory experiment example: • We give a n = 16 memory patients a memory improvement treatment. • Step 2 : Set your decision criteria H 0 : Treatment > pop = 60 H A : Treatment < pop = 60 = 0.05 One -tailed • How do they compare to the general population of memory patients who have a distribution of memory errors that is Normal, = 60? • After the treatment they have an average score of = 55, s = 8 memory errors. An example: One sample t-test
Slide21Statistics for theSocial Sciences One sample t-test An example: One sample t-test Memory experiment example: • We give a n = 16 memory patients a memory improvement treatment. • Step 2 : Set your decision criteria H 0 : Treatment > pop = 60 H A : Treatment < pop = 60 = 0.05 One -tailed • How do they compare to the general population of memory patients who have a distribution of memory errors that is Normal, = 60? • After the treatment they have an average score of = 55, s = 8 memory errors.
Slide22Statistics for theSocial Sciences One sample t-test An example: One sample t-test Memory experiment example: • We give a n = 16 memory patients a memory improvement treatment. = 0.05 One -tailed • Step 3 : Collect your data H 0 : Treatment > pop = 60 H A : Treatment < pop = 60 • How do they compare to the general population of memory patients who have a distribution of memory errors that is Normal, = 60? • After the treatment they have an average score of = 55, s = 8 memory errors.
Slide23Statistics for theSocial Sciences One sample t-test An example: One sample t-test Memory experiment example: • We give a n = 16 memory patients a memory improvement treatment. = 0.05 One -tailed • Step 4 : Compute your test statistics = -2.5 H 0 : Treatment > pop = 60 H A : Treatment < pop = 60 • How do they compare to the general population of memory patients who have a distribution of memory errors that is Normal, = 60? • After the treatment they have an average score of = 55, s = 8 memory errors.
Slide24Statistics for theSocial Sciences One sample t-test An example: One sample t-test Memory experiment example: • We give a n = 16 memory patients a memory improvement treatment. = 0.05 One -tailed • Step 4 : Compute your test statistics t = -2.5 H 0 : Treatment > pop = 60 H A : Treatment < pop = 60 • How do they compare to the general population of memory patients who have a distribution of memory errors that is Normal, = 60? • After the treatment they have an average score of = 55, s = 8 memory errors.
Slide25Statistics for theSocial Sciences One sample t-test An example: One sample t-test Memory experiment example: • We give a n = 16 memory patients a memory improvement treatment. = 0.05 One -tailed • Step 5 : Make a decision about your null hypothesis H 0 : Treatment > pop = 60 H A : Treatment < pop = 60 • How do they compare to the general population of memory patients who have a distribution of memory errors that is Normal, = 60? • After the treatment they have an average score of = 55, s = 8 memory errors. t crit = -1.753
Slide26Statistics for theSocial Sciences One sample t-test An example: One sample t-test Memory experiment example: • We give a n = 16 memory patients a memory improvement treatment. = 0.05 One -tailed • Step 5 : Make a decision about your null hypothesis H 0 : Treatment > pop = 60 H A : Treatment < pop = 60 • How do they compare to the general population of memory patients who have a distribution of memory errors that is Normal, = 60? • After the treatment they have an average score of = 55, s = 8 memory errors. -1.753 = t crit t obs =-2.5 - Reject H 0
Slide27Statistics for theSocial Sciences Next time • Related samples t-tests • Independent samples t-tests • Using SPSS with t-tests (maybe next Monday)