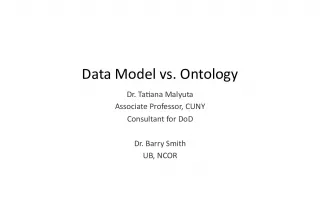
Understanding Data Modeling: Real World Objects, Levels and Modeling Process

This article explains the real-world objects and relationships database schema, data model levels (conceptual, logical, physical), and the five-step process of data modeling. The article also includes graphical representation courtesy of ESRI.
- Uploaded on | 14 Views
-
 aarnakulas
About Understanding Data Modeling: Real World Objects, Levels and Modeling Process
PowerPoint presentation about 'Understanding Data Modeling: Real World Objects, Levels and Modeling Process'. This presentation describes the topic on This article explains the real-world objects and relationships database schema, data model levels (conceptual, logical, physical), and the five-step process of data modeling. The article also includes graphical representation courtesy of ESRI.. The key topics included in this slideshow are Data modeling, Real world objects and relationships, Conceptual model, Logical model, Physical model, UML diagram, Geodatabase elements, Modeling process, ESRI,. Download this presentation absolutely free.
Presentation Transcript
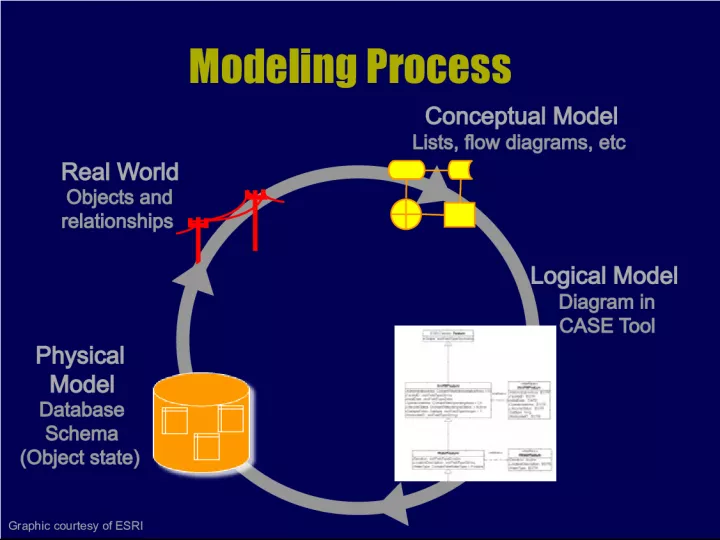
1. Real World Objects and relationships Database Schema (Object state) Physical Model Modeling Process Conceptual Model Lists, flow diagrams, etc Logical Model Diagram in CASE Tool Graphic courtesy of ESRI
2. Data Model Levels Increasing Abstraction Reality Reality Conceptual Model Conceptual Model Logical Model Logical Model Physical Model Physical Model Human- oriented Computer- oriented
3. Steps in Data Modeling (1) Conceptualize the user's view of data what are the basic features needed to solve the problem? (2) Select the geographic representation points, lines, areas, rasters, TINs (3) Define objects and relationships draw a UML diagram, specify relationships, behaviors (4) Match to geodatabase elements Refine relationships, behaviors (5) Organize geodatabase structure, add data
4. UML ( cont. ) Diagrammatic notation = visual language... For constructing a data model Drawings, relationships constructed in Visio Tools to input a drawing to ArcGIS input data to the data model
5. UML Notation Zeiler pp. 97-99 a class is shown as a box top part: name of class lower part: attributes methods associated with the class lines connect boxes, indicate relationships
7. Graphic courtesy of Maidment et al., ArcHydro team
8. UML Notation ( cont. ) Abstract class specify subclasses underneath no new instances Feature Class Specify subtypes underneath Food Veggies Meats
9. Relationships Links between classes, shown as lines One to one One to many Many to many
10. Relationships (cont.) 1:1 - solid line one record in Class A linked to one record in Class B is married to the class of state capitals linked to the class of states 1:n - solid line with * at one end one record in Class A linked to any number of records in Class B "owns" the class of states linked to the class of area codes
11. Graphic courtesy of Maidment et al., ArcHydro team
12. Relationships (Arc Marine example)
13. Relationships (cont.) m:n - solid line with * at both ends any number of records in Class A linked to any number of records in Class B "has visited "was never married to" the class of mountain lions linked to the class of wilderness areas
14. Image courtesy of Dan Fornari, Woods Hole Oceanographic Institution Study Area Study Area
15. Type Inheritance White triangle Class B inherits the properties (attributes, methods) of Class A the class street inherits from the class transportation network Solid diamond the parts and the whole depend on each other lecture lab
16. Graphic courtesy of Maidment et al., ArcHydro team
18. Real World Objects and relationships Database Schema (Object state) Physical Model Modeling Process Conceptual Model Lists, flow diagrams, etc Logical Model Diagram in CASE Tool Graphic courtesy of ESRI
19. Steps in Data Modeling (1) Conceptualize the user's view of data what are the basic features needed to solve the problem? (2) Select the geographic representation points, lines, areas, rasters, TINs (3) Define objects and relationships draw a UML diagram, specify relationships, behaviors (4) Match to geodatabase elements Refine relationships, behaviors (5) Organize geodatabase structure, add data
20. or XMI file
21. Using a Design Template Schema Wizard reads repository or XMI to create a geodatabase
22. or XMI file
23. Steps in Data Modeling (1) Conceptualize the user's view of data what are the basic features needed to solve the problem? (2) Select the geographic representation points, lines, areas, rasters, TINs (3) Define objects and relationships draw a UML diagram, specify relationships, behaviors (4) Match to geodatabase elements Refine relationships, behaviors (5) Organize geodatabase structure, add data e.g., Marine Data Model tutorial
24. Arc Marine Data Model Exercise Exercise and data at dusk.geo.orst.edu/djl/arcgis/ArcMarine_Tutorial/ What to turn in: Screen snapshot of what your ArcMap session looks like at the end of Section 4 (including dynseg referencing) Answers to 2 simple questions at end of Section 4 (which cruise? which vehicle?) Can put all of the above in a single MS-Word document, labeled with your NAME please! Due in Dropbox, Apr. 29 , 6:00 p.m.
25. Geoprocessing Models Model Builder diagrams for workflow Raster in WGS84 extract_west Shifted_west Output grid name Extract_east Raster in WGS84 Extract by Rectangle (2) Output Extent Output Extent Output Extent Shift Extract by Rectangle (3) Extract by Rectangle Mosaic Output Extent
26. Resulting Analysis - ArcHydro From Arctur and Zeiler, Geodatabase Design , ESRI Press.
27. Gateway to the Literature Arctur, D. and Zeiler, M., 2004, Designing Geodatabases , ESRI Press Lowe, J.W., 2003. Flexible data models strut the runway. Geospatial Solutions , 13(2): 44-47. Maidment, D.R., 2002. Arc Hydro: GIS for Water Resources , ESRI Press, 203 pp. w/CD. Li, X. and M.E. Hodgson, 2004. Vector-field data model and operations. GISci. Rem. Sens. , 41(1): 1-24. Wright, D., Blongewicz, M., Halpin, P., and Breman, J., Arc Marine: GIS for a Blue Planet , Redlands: ESRI Press, 2007. In the classroom or dusk.geo.orst.edu/djl/arcgis/book.html
29. MeasuredData InstantaneousPoint (ex: CTD) InstantaneousPoint (ex: CTD) Measurement X X Y Y TimeStamp TimeStamp MeasuringDevice MeasuringDevice MeasuredType Z Z InstantaneousPoints Measurement Michael Blongewicz
30. Objects and Features Object (real world) in ArcGIS an object is non-spatial it is NOT a point, line, or area it has no geographic location it has no shape attribute in its table Drainage network, ship, vehicle , customer, lake, house, etc. Feature (spatial context) an object that has geographic location a point, line, area, TIN, raster