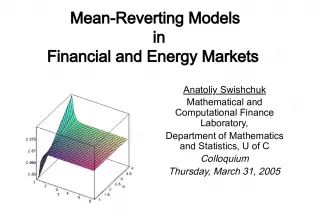
Explicit Option Pricing Formula for Mean Reverting Asset
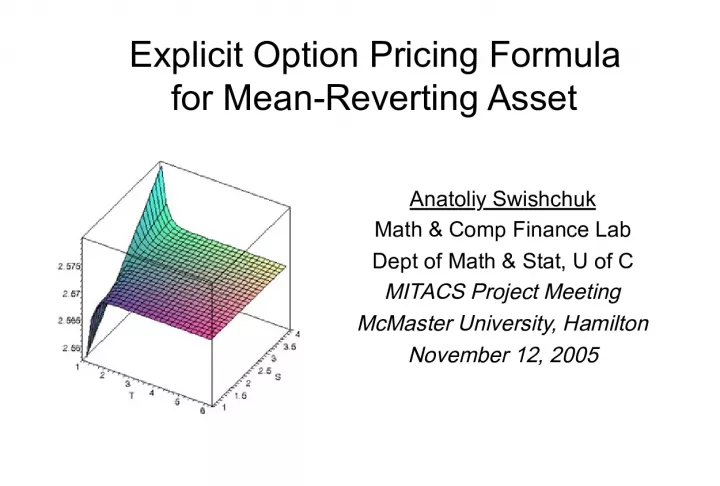

This presentation by Anatoliy Swishchuk, from the Math & Comp Finance Lab at the University of Calgary, discusses the use of mean-reverting models (MRM)
- Uploaded on | 0 Views
-
 arianema
About Explicit Option Pricing Formula for Mean Reverting Asset
PowerPoint presentation about 'Explicit Option Pricing Formula for Mean Reverting Asset'. This presentation describes the topic on This presentation by Anatoliy Swishchuk, from the Math & Comp Finance Lab at the University of Calgary, discusses the use of mean-reverting models (MRM). The key topics included in this slideshow are . Download this presentation absolutely free.
Presentation Transcript
Slide1Explicit Option Pricing Formulafor Mean-Reverting Asset Anatoliy Swishchuk Math & Comp Finance Lab Dept of Math & Stat, U of C MITACS Project Meeting McMaster University, Hamilton November 12, 2005
Slide2Outline• Mean-Reverting Models (MRM): Deterministic vs. Stochastic • MRM in Finance Markets: Variances or Volatilities (Not Asset Prices) • MRM in Energy Markets: Asset Prices • Change of Time Method (CTM) • Mean-Reverting Model (MRM) • Option Pricing Formula • Drawback of One-Factor Models • Future Work
Slide3Motivations for the Work• Paper : Javaheri, Wilmott and Haug (2002) ”GARCH and Volatility Swaps”, Wilmott Magazine, Jan Issue (they applied PDE approach to find a volatility swap for MRM and asked about the possible option pricing formula • Paper : Bos, Ware and Pavlov (2002) “ On a Semi-Spectral Method for Pricing an Option on a Mean-Reverting Asset”, Quantit. Finance J. (PDE approach, semi-spectral method to calculate numerically the solution)
Slide4Mean-Reversion Effect• Guitar String Analogy : if we pluck the guitar string, the string will revert to its place of equilibrium • To measure how quickly this reversion back to the equilibrium location would happen we had to pluck the string • Similarly, the only way to measure mean reversion is when the variances of asset prices in financial markets and asset prices in energy markets get plucked away from their non-event levels and we observe them go back to more or less the levels they started from
Slide5The Mean-Reverting Deterministic Process
Slide6Mean-Reverting Plot (a=4.6,L=2.5)
Slide7Meaning of Mean-Reverting Parameter• The greater the mean-reverting parameter value, a , the greater is the pull back to the equilibrium level • For a daily variable change, the change in time, dt , in annualized terms is given by 1/365 • If a =365 , the mean reversion would act so quickly as to bring the variable back to its equilibrium within a single day • The value of 365/ a gives us an idea of how quickly the variable takes to get back to the equilibrium-in days
Slide8Mean-Reverting Stochastic Process
Slide9Mean-Reverting Models in FinancialMarkets • Stock (asset) Prices follow geometric Brownian motion • The Variance of Stock Price follows Mean-Reverting Models • Example: Heston Model
Slide10Mean-Reverting Models inEnergy Markets • Asset Prices follow Mean- Reverting Stochastic Processes • Example: Pilipovic Model
Slide11Mean-Reverting Models in EnergyMarkets
Slide12CTM for Martingales
Slide13CTM for SDEs. I.
Slide14CTM for SDEs. II.
Slide15Connection between phi_t and phi_t^(-1)
Slide16Idea of Proof. I.
Slide17Idea of Proof. II.
Slide18Mean-Reverting Model
Slide19Solution of MRM by CTM
Slide20Solution of GBM Model (to compare)
Slide21Properties of
Slide22Explicit Expression for
Slide23Explicit Expression for
Slide24Explicit Expression for S(t)
Slide25Properties of
Slide26Properties of
Slide27Properties of Eta(t). II.
Slide28Properties of MRM S(t). I.
Slide29Dependence of ES(t) on T
Slide30Dependence of ES(t) on S_0 and T
Slide31Properties of MRM S(t). II.
Slide32Dependence of Variance of S(t) on S_0 and T
Slide33Dependence of Volatility of S(t) on S_0 and T
Slide34Drawback of One-Factor Mean-Reverting Models • The long-term mean L remains fixed over time : needs to be recalibrated on a continuous basis in order to ensure that the resulting curves are marked to market • The biggest drawback is in option pricing: results in a model-implied volatility term structure that has the volatilities going to zero as expiration time increases ( spot volatilities have to be increased to non-intuitive levels so that the long term options do not lose all the volatility value-as in the marketplace they certainly do not )
Slide35European Call Option for MRM.I.
Slide36European Call Option. II.
Slide37Expression for y_0 for MRM
Slide38Expression for C_T in the case ofMRM C_T=BS(T)+A(T)
Slide39Expression for C_T=BS(T)+A(T).II.
Slide40Expression for BS(T)
Slide41Expression for A(T).I.
Slide42Expression for A(T).II.Characteristic (moment generating) function of Eta(T):
Slide43Expression for A(T). II.
Slide44European Call Option for MRM(Explicit Formula)
Slide45Boundaries for C_T
Slide46European Call Option for MRM in Risk-NeutralWorld
Slide47Boundaries for MRM in Risk-Neutral World
Slide50Dependence of C_T on T
Slide51Paper may be found on the following web page( E-Yellow Series Listing, Dept of Math & Stat, U of C, Calgary, AB ): http://www.math.ucalgary.ca/research/preprint.php
Slide52Future work . I: Analytical Approach (Integro – Partial DE) (Joint Working Paper with T. Ware)
Slide53Future Work .II: Probabilistic Approach( Change of Time Method ).
Slide54The End Thank You for Your Attention and Time!