Understanding Hodographs in Meteorology

This article explores the importance of hodographs in meteorology. It covers the basics of hodographs, their uses and benefits, and provides insights from experts in the field.
- Uploaded on | 1 Views
-
 baron
baron
About Understanding Hodographs in Meteorology
PowerPoint presentation about 'Understanding Hodographs in Meteorology'. This presentation describes the topic on This article explores the importance of hodographs in meteorology. It covers the basics of hodographs, their uses and benefits, and provides insights from experts in the field.. The key topics included in this slideshow are Hodographs, Meteorology, Storm Type, Severe Threat, Storm Motion, Turbulence, Mountain Waves,. Download this presentation absolutely free.
Presentation Transcript
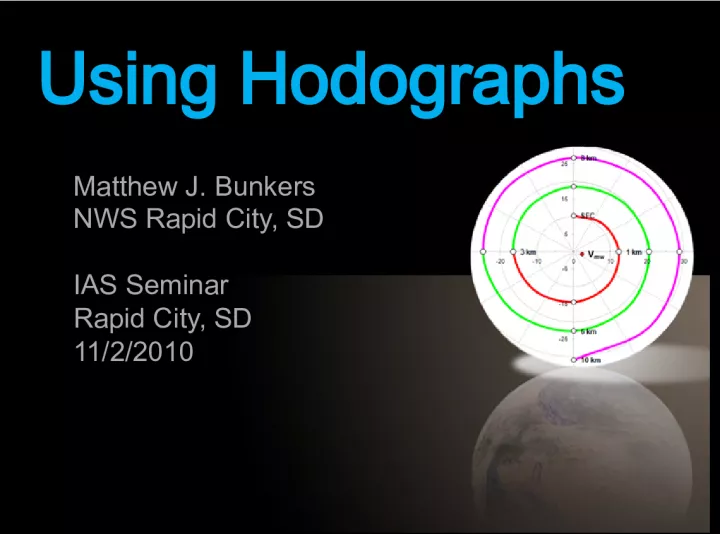
1. Using Hodographs Matthew J. Bunkers NWS Rapid City, SD IAS Seminar Rapid City, SD 11/2/2010
2. Why should we care about hodographs? 2 Wikipedia NWS UNR
3. Why should we care about hodographs? 3 Tom Warner Unknown NWS UNR
4. Why should we care about hodographs? 4
5. Why should we care about hodographs? 5 Storm type Severe threat Storm motion Infer thermal advection Infer quadrant of cyclone/anticyclone Bluestein and Banacos (2002, MWR) Turbulence, mountain waves Others
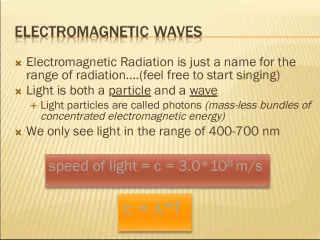
6. First, what is a hodograph? 6 Something all severe weather forecasters should know how to use and interpret A line connecting the tips of wind vectors between two arbitrary heights in the atmosphere A plot of vertical wind shear from z 1 to z 2
7. 7 Ground-relative winds
8. 8 There is nothing magic about 0 6 km
9. 9 V V = V top V bot (shear vector) V bot V top
10. 10 Shear also can be displayed this way, but it doesnt show direction
11. 11 Bulk shear = V between two levels 0 6-km shear vector Mag. = 35.9 m s -1 Shear = 0.006 s -1 (disregards shape of the hodograph)
12. 12 Total shear = sum of V over layers Mag. = 51.0 m s -1 Shear = 0.008 s -1 (sensitive to depth of shear layers, curvature, loops, and wiggles)
13. 13 Positive shear = clockwise/neutral turning Mag. = 40.1 m s -1 Shear = 0.007 s -1 (sensitive to depth of shear layers, curvature, loops, and wiggles)
14. 14 0 6-km shear Bulk = 15.7 m s -1 Total = 38.5 m s -1 Pos. = 23.7 m s -1 (loops and wiggles are a problem here) When in doubt, look at the hodograph
15. 15 Effective shear may be more appro- priate than 06-km shear at times Thompson et al. (2007, WAF)
16. 16 Total shear always bulk shear Bunkers et al. (2002, 21 st SLS: http://ams.confex.com/ams/pdfpapers/47319.pdf )
17. Not all hodographs are created equal 17 Height intervals should be even and labeled, with shear highlighted by varying colors E.g., plot every 0.5 km; dot or label every 1 km Some hodographs have uneven spacing Some hodographs are not labeled Some hodographs dont vary the color Distribution of shear is important
18. 18 Bunkers http://wdtb.noaa.gov/tools/BUFKIT/ Also see NSHARP NWS AWIPS
19. Hodographs can be difficult to visualize from a sounding alone 19 Markowski and Richardson (2006, WAF)
20. Hodographs can be difficult to visualize from a sounding alone 20 Markowski and Richardson (2006, WAF)
21. 21 Why is shear important? h Markowski et al. (2008, MWR) Handout hodograph and plot h and V SR
22. 22 V 2 V 1 h = k V h / z (horizontal vorticity*) 2 * Ignoring horizontal changes in vertical wind Horizontal vorticity points to left of shear 1
23. 23 Storm-relative vs. ground-relative winds V - C = V SR = SR wind V SR V C
24. 24 Storm-relative vs. ground-relative winds The storm- relative winds matter most because that is what the storm sees (e.g., see next slide) V - C = V SR = SR wind V SR
25. 25 D ifferences in storm-relative flow can alter anvil orientations Lindsey and Bunkers (2005, WAF)
26. 26 Storm-relative helicity (V SR and h ) SRH = (V SR h ) dz 1 2 3 4 5 6 V SR h leads to pure cross- wise vorticity SRH 0 3 = 0 for storm motion along straight hodograph
27. 27 V SR || h leads to pure stream- wise vorticity SRH 0 3 >> 0 for motion at center of circu- lar hodograph (621 m 2 s -2 or J kg -1 in this case) Storm-relative helicity (V SR and h ) 1 2 3 SRH = (V SR h ) dz
28. 28 Usually a mix of streamwise and crosswise vorticity is observed SRH = (V SR h ) dz SRH 0 3 = -2 area swept out by V SR on hodograph SRH 0 1 (or 0.5 km) is rather important for tornadoes
29. 29 SRH often has large variability in both time and space (in the CBL) SRH 0 3 also can vary over 100 m 2 s -2 for different zs Markowski et al. (1998, 19 th SLS, 363-366) Markowski and Richardson (2007, MWR)
30. Anticipating storm motion is very important for SRH, and other indices 30 Mike Umscheid Ziebach County/NWS UNR Matt Bunkers Brian Morganti
31. 31 Storm motion is comprised of advection and propagation Advection Mean wind Propagation Updraft shear interactions (for supercells) Gust-front propagation Boundary layer convergence features Storm mergers and interactions Orographic features Others (e.g., gravity waves)
32. 32 Supercell motion is dominated by advection and updraft shear forcings COMET
33. 33 Most of the time supercell motion can be predicted well using a hodograph 1) Plot a representative mean wind (e.g., 0- 6km, 0-8km, 1-7km) Bunkers et al. (2000, WAF); Zeitler and Bunkers (2005, NWD) 2) Draw a shear vector from the BL to 5.5-6km 3) Draw a line that both passes through the mean wind and is orthogonal to the shear vector (i.e., the updraft- shear propagation component) 4) Plot the RM and LM supercells 7-8 m/s from the mean wind (this can be variable)
34. Methods to predict supercell motion should be Galilean invariant 34 Supercell motion based on mean wind (e.g., 30 to the right and 70% of the mean wind speed) is not Galilean invariant 30R75 30R75 30R75
35. 35 #1 #2 #3 #4 Time for some practiceplot the supercell motion
36. Case #1 36
37. Case #2 37
38. Case #3 38
39. Case #4 39
40. Time for hodograph demo http://www.crh.noaa.gov/unr/?n=scm 40
41. 41 Now you have to make a choice You take the blue pill, and the seminar ends or you take the red pill, and you learn more about hodographs Remember that all I am offering is the truth. Nothing more - Morpheus
42. The length and shape of the hodo- graph helps determine storm type 42 (or splitting supercells)
43. The length and shape of the hodo- graph helps determine storm type 43 (or splitting supercells) Courtesy of Paul Markowski
44. The length and shape of the hodo- graph helps determine storm type 44 Dominant RMs Dominant LMs
45. Real-world observations tend to support this 45 Bunkers (2002, WAF)
46. The distribution of the shear helps determine severe threat 46 Severe SCs Non-svr SLs Severe SLs Severe Bows Sig TOR SCs Klimowski et al. (2003, WAF) Esterheld and Giuliano 2008, EJSSM) Rapid City flood
47. 47 Other shear-related indices are derived from either shear or SRH BRN = CAPE / (bulk shear) Other common indices include EHI, VGP, SCP, and STP
48. 48 SRH also can be used as a proxy for 850 700-mb temperature advection
49. No! 49 Can you become friends with hodographs on Facebook?
50. 50 But you can find out more here Doswell, C. A., III, 1991: A review for forecasters on the application of hodographs to forecasting severe thunderstorms. Natl. Wea. Dig., 16, 216. http://www.cimms.ou.edu/~doswell/hodographs/hodographs.html Hodograph spreadsheets: http://www.crh.noaa.gov/unr/?n=scm Principles of Convection II : Using Hodographs http://www.meted.ucar.edu/mesoprim/hodograf/ Predicting Supercell Motion in Operations ftp://rammftp.cira.colostate.edu/bikos/audio/scmotion_audio.exe