Scientific Method

In this unit, titled "Scientific Experiments," students will learn about the scientific method, which is a procedure used to understand a phenomenon or solve a problem. The method involves two main components: observations, which
- Uploaded on | 2 Views
-
 debbiemorris
About Scientific Method
PowerPoint presentation about 'Scientific Method'. This presentation describes the topic on In this unit, titled "Scientific Experiments," students will learn about the scientific method, which is a procedure used to understand a phenomenon or solve a problem. The method involves two main components: observations, which. The key topics included in this slideshow are . Download this presentation absolutely free.
Presentation Transcript
Slide1Unit 3: Scientific ExperimentsCore 270 Spring 2008 Dr. Sharon Fredericks
Slide2Scientific Method• Recall: The scientific method is a procedure used to understand a phenomenon or solve a problem • It contains: – Observations: monitoring what happens without intervention; some sciences rely only on passive observations (e.g., astronomy) – Experiments: Change certain things to discover whether the changes made a difference in the observations. • Most scientists prefer to actively perform experiments. This involves: – Designing the experimental procedure – Designing the experimental apparatus – Executing the experiment – Analyzing the experiment
Slide3Designing the ExperimentalProcedure • Aspects of scientific experimental design 1 – Selecting a topic – First Principles & Hypothesis – Measures – Variables – Sample Selection – Controls & Standards – Bias – Replication – Randomization – Statistical Significance
Slide4Selecting a Topic of Study2 • Critical Review of the literature – “First Principles” • Based on interest, technical expertise, resources, ability to get funding, proper skills, equipment, analysis … • Experiments require a large amount of intellectual energy & time so an avid interest is a must. • Scientist must determine whether he or she has the necessary skills and equipment and can justify the experiments to a funding agency.
Slide5First Principles• These are the foundations upon which the experiment is being designed. • I think of this as “background” material. • The scientist must understand everything related to the proposed experiment – ______________________________of the problem – Hypotheses, Theories, Laws of nature _______________ ________________________________________________ • Using this knowledge the working hypothesis and experiments are created & revised.
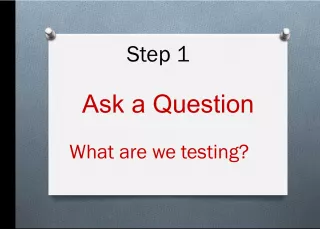
Slide6Hypothesis2 • Possible ________________________________ of some phenomenon • Clearly stated • _________________________________ • Vary in precision & complexity • Examples – Sleep will affect test performance – The amount of sleep a student has the night before an exam will affect test performance.
Slide7How to develop hypotheses2 • Analogy – Similar situations may lead to similar results – E.g., gorillas raise their young in the same way as chimps • Induction – Observations of a specific phenomenon are generalized – E.g., observe some trees being killed by insects; hypothesize that all tree deaths in a forest are due to insects • Deduction – Based on better-established scientific knowledge – E.g., From what is known about the Greenhouse Effect, increasing the amount of CO 2 will increase the atmospheric temperature.
Slide8How to develop hypotheses2 • Intuition – Gut feeling – E.g., Kekul é had a dream about a snake biting its tail and from that determined the structure of benzene • Eureka intuition – A scientist connects the problem under study with a common event; requires the correct knowledge and insight. – E.g., Archimedes figured out how to determine whether a crown was pure gold. • Serendipity – An unexpected observation is the key to insight and discovery; also requires keen insight and scientific training. – E.g., Fleming’s discovery of penicillin
Slide9Archimedes’ ProblemJohn Fredericks
Slide10Archimedes continuedJohn Fredericks
Slide11Archimedes’ DiscoveryJohn Fredericks
Slide12What method was used to determinethe hypothesis? • An instructor observed that a major problem with a chemistry laboratory exercise or experiment is that students get too much information in a short time just before the lab class. He read a study where instructors met with students 2 days before the lab. He hypothesized that students would be better prepared if they met with the instructor a week before doing the experiment. [ J. Chem. Ed ., 83, 7 (2006)]
Slide13•A child learned that mice can be taught to go through a maze. He hypothesized that his pet gerbil could do it, too. • Becquerel was studying how sunlight caused energy to be emitted from uranium. But one day, it was cloudy so he put a photographic plate wrapped in dark paper and a uranium sample in a drawer. A few days later, he found that the photographic plate had been exposed without the presence of sunlight. He hypothesized that the uranium must naturally emit energy, and this lead to the discovery of radioactivity.
Slide14Measures• After the hypothesis is created, the next step is to determine what to measure in the experiment. • The method should be ____________________ and free from bias. • All data should be collected in a ____________ manner to ensure reliability. • In most sciences, _________________________ are made. – In some areas, this is not possible. E.g., dinosaurs
Slide15Measures• An important decision is the type of measure to use. • Comparative measures: describe one phenomenon to another; may use relative terms (e.g., faster, better, longer, more) • Absolute measures: describe every phenomenon _________________________________________ • Scientists prefer absolute measures so that statistical analyses can be done. – Comparative: Rat 1 did the maze faster than Rat 2. – Absolute: Rat 1 did the maze 50% faster than Rat 2.
Slide16Variables• Variable : A ____________that is ____________ to see what the effect is on the ____________ There may be more than one variable. • True variables : Variables that fundamentally affect the natural phenomenon under study – A.k.a ________________________________variables – __________________________________conditions without which the observables would not occur. – Sometimes true variables are held constant to make the analysis easier
Slide17Variables• Confounding Variable : Variables that the scientist has ______________over and that may incidentally affect results. Sometimes these turn out to be true variables because scientists can’t predict every true variable. Present in “field” studies. • “Experimenters must not only design new techniques but they must be able to prove that confounding factors are not polluting the results” 3
Slide18Variables• Dependent Variable: what is being ___________________________ • “Determining which variables are to be included in an experiment is important because leaving out a significant one diminishes the value of the results while including insignificant ones increases the time, cost, and complexity of the work.” 2
Slide19Example• When measuring the affect of the amount of sleep on test performance, some confounding variables may be: – Amount of studying that was done! • This could be changed and hence is a true variable. Have subjects study the same amount of time. This, however, does not ensure that the preparation is of the same quality! – Amount of deep sleep vs. light sleep • May not be able to modify – a real confounding variable – Time when sleeping (9pm – 6am vs. 3am – 12 noon) and conditions of sleep • This could be changed so all subjects sleep the same amount of time and under the same conditions. – Can you think of any others?
Slide20Sample Selection1, 2 • Sample: relatively small number of individuals or instances on which the experiment is performed. • Questions to be asked in selecting sample: – What needs to be studied? – How are the subjects to be studied selected? – Are they ____________________of the class of objects in the hypothesis? Does my sample adequately represent all possible events or subjects that are studied? – Sampling size needs to be considered as well. The larger the number of true variables, the larger the sampling size. The larger the sampling size, the more expensive the experiment.
Slide21Examples• A company would like to test a new wood stain that would be appropriate for decks and porches. What would be a representative sample? • A study is to be done on the effect of a sports drink on athletic performance. What would be a representative sample?
Slide22Examples• A scientist would like to determine the effect of the dosage of vitamin E on the number of colds experienced by elderly people. What would a representative sample be? How many subjects is needed? What else effects colds? JAMA article source: Science News 9/4/2004, Vol. 166 Issue 10, pg. 157
Slide23Controls and Standards1 • Quality control: monitoring of all components of the experiment • Standard: (1) Anything against which comparisons can be made. (2) The procedure determined to be the routine way to do something. • Subject : Individual who undergoes full testing of the phenomenon • Control : One or more of the subjects___________ ________________________________________ in the main variable. May not be exposed to the variable at all. Crucial to see _________________ ________________________________________
Slide24Examples• Hypothesis: Tide detergent with bleach is a superior detergent than any on the market. What is the control group? What is the experimental group? • Hypothesis: medications that inhibit the COX-2 enzyme production will prevent pancreatic cancer cells from growing.
Slide25Your turn:• Hypothesis: A banana will ripen faster if placed in a paper bag at room temperature. • Hypothesis: If mice are injected with a vaccine for SARS, it will not develop the disease after exposure to it. • Hypothesis: There are more behavioral problems at schools after a night with a full moon.
Slide26Bias• Prejudice or preference for an experimental result • Discovering the sources of bias, correcting for them, and repeating the experiment is common in science. • Experimenter bias : – Does not have the skills to perform experiment – Needs certain results to get funding
Slide27Experimenter Bias• Example 1: Clever Hans 2 – Horse could do arithmetic. – Subconscious signaling on the part of the handler (nod head, relax muscles) • Example 2: N-rays 2,3 – 1903 Ren é Blondlot discovered n-rays – Some researchers in other countries couldn’t duplicate his experiments – Robert Wood visited and removed a key component (prism) of the experimental apparatus, yet Blondlot still observed n-rays – Wishful thinking on the part of the experimenter; falsification by Wood • To eliminate: reduce the amount of subjective decisions by experimenter
Slide28Subject Bias• Subject bias : – Form of psychological bias 2 • Placebo Effect : People in the group taking the placebo, which has no effective ingredient of physiological effect, improve. • To eliminate, the subjects should not know if they are taking the drug or the placebo.
Slide29Instrument Bias• Instrument bias : instrument may give one type of result more than others or presence of the instrument may change the results – Lack of precision or faulty measuring – Example: Testing the change of heat for a reaction using a thermometer • Let’s say that the thermometer reads to the ones place (e.g., 20, 21, 22 degrees and not 20.5, 21.5 degrees), so it may read 21 all the time even though the temperature may truly be changing. • Let’s say it reads “hot”, due to faulty measuring. So, the measured temperatures will be too high. – Example: Inserting a water meter may change the water flow; thus changing the measurement 1
Slide30Sampling Bias• Sampling bias : – Common in clinical trials where cost forces the samples to be small in the initial trials • Not all side effects of a medication may be observed – E.g., More experienced subjects are placed in the experimental group; less experienced in the control group; thereby skewing results – E.g., 1936 poll showed Roosevelt losing in the Presidential election 2
Slide31To counteract Bias• Blind research: ______________________do not know if they are the experimental or control group • Double-blind research: Neither ______________ nor __________________________________ knows which group the participant belongs • Have instruments not people detect and record results • Be sure sample is ______________________ when selecting • __________________________________divide subjects into the control and experimental groups
Slide32Replication & Randomization• Replication : Performing all aspects of the experiment more than once. – Self-replication: – Peer-replication: • Randomization : Performing the experiment under different conditions that should not affect the experiment (e.g., time of day) or selecting subjects without preference (e.g., which should be the control).
Slide33Statistical Significance• When designing an experiment, the level of statistical significance should be determined to whether the experiment is a success or needs to be redesigned. What constitutes clear support of the hypothesis? What indicates a clear contradiction? • Example: For the Pepsi taste test, what percent indicates a clear preference for Pepsi? 51%? 75%? 90%
Slide34Correlation & Causality• 2 related variables may be correlated but one may not cause a change in the other. • The step from correlation to causality is difficult because one can not be sure if one is seeing an “illusion” or ignoring a significant unknown factor. 3 • Example: Population of rabbits and mice in an area follow the same pattern of increase and decrease over time. They are correlated. But this does not guarantee that one causes the change in the other. This may be caused by the number of predators in the area. 2
Slide35Correlation and Causality• Recall: Correlation between a factor and outcome becomes causality when 3 – A high positive correlation exists – Repeated experiments using different techniques support correlation – A well-founded explanation (mechanism) exists to explain the relationship.
Slide36Establishing Causality• To establish causality, in particularly in the medical sciences 3 : – Experimentation – Epidemiology – Research on potential mechanisms
Slide37Experimentation3 • Initial experiments are done in the laboratory, but results do not guarantee that the medication will be effective in the human body – Analogs on animals • Clinical trials follow where one group is given the experimental drug and the other a traditional drug or a placebo. – Double-blind – Ethical considerations – Use statistical means to determine if experimental drug is as good or better than the traditional drug
Slide38Epidemiology3 • Study of the disease by ___________________________ • John Snow and Ignaz Semmelweis (19 th century) started the field by taking quantitative measurements to correlate a factor and a disease – Source of drinking water with cholera – Doing autopsies and infection in an obstetrics ward – Later an explanation was developed that linked the diseases with bacteria • Modern studies must be long-term – Forward ones follow a population over time with interviews, questionnaires, test; cooperation a problem – Backward ones use records or a population of sick people and ask them about their former habits, etc. Problem is forgetfulness. – With either method, care is given to avoid bias and confounding variables
Slide39Research on potential mechanisms3 • Before modern science, trial and error was used in medical treatment. Mechanism not known. • First mechanisms discovered were bacteria and microorganisms • More modern science has involved genetics and chemicals
Slide40Designing the ExperimentalApparatus 1 • 6 important aspects: – Specifications of all materials and equipment are fully described (make, model, sensitivity, etc) – Stock vs. custom – stock has the advantage of extensive testing – Serviceability – repairs or replacements must be done easily; technicians are sometimes required – Operational convenience of both equipment and software – easily and quickly done – Disturbing factors – include electronic interference, heat, vibration, noise – Calibration – instruments are compared with standards to be sure they are operating correctly.
Slide41Executing the Experiment1 • Understanding and Controlling the Experiment – being able to understand how to use the equipment to do an experiment, as well as to know what not to do (not to break it!). • Time Efficiency – using your time wisely. Some experiments have a lot “wait” time. Other experiments can take 8-10 hours straight. • Record keeping – traditional method involves a notebook, where each page is written ___________, __________and _________________and _____________thorough record of a research project – Helps in writing up a paper – Used by another scientist to replicate the experiments – Support in a discovery or patent dispute – Proof against misconduct
Slide42Executing Experiments: errors2 • Systematic errors –same for all measurements. May be due to poor calibration or protocol. • Personal errors – due to judgment of experimenter when making a measurement – First testing with a known quantity will remove • Mistakes – reading and/or writing data down incorrectly; sloppiness, laziness with respect to procedure (taking short cuts)
Slide43Analyzing the Experiment• Hypothesis testing – ______of the experiment; data is analyzed to see if it supports the hypothesis, does not support the data or is inconclusive. – Aided by setting up a null hypothesis (what results would reject hypothesis). – Negative results which do not support the hypothesis are valuable, but positive results are easier to publish. • Curve Fitting - analytical method used to _______ and ________________________a set of data points. – Curve has a mathematical equation that gives insight on the relationship between the property on the x axis (independent variable) and that on the y axis (dependent variable). Used to predict data. – Allows “odd” data to stand out; need to determine why.
Slide44Example of Curve Fitting
Slide45Analyzing the Experiment• Statistical analysis – analyzing and interpreting a large amount of data (e.g. to determine mean, standard deviation) • Analysis of errors – Uncertainty or “confidence level” or “significance level”. There is always a margin of uncertainty because no measurement is 100% precise or accurate. (+/-). – Errors of omission – those done because a key component has been left out – either by poor experimental design or the failure to recognize a true variable – Errors of commission – those done by doing the experiment incorrectly. Boucher, D. from handouts for Physics100
Slide46Results• A post-hoc hypothesis is ___________________. • Results should support or refute the original hypothesis. • If the data does not support a hypothesis, then a new, better hypothesis should be created and more experiments should be designed and executed with this hypothesis in mind. • “Experiments are done to test hypotheses, not to confirm them;…” 2 • In the discussion of the results, the scientist tries to tie in the new data with what is already known and state the significance of the findings.
Slide47Discussion of Results• Presenting results – the last step is to share results to the scientific community. • Within a specific discipline, some journals have more prestige than others because of the difficulty in publishing in them.
Slide48Nonexperimental Research2 • Answers questions rather than test predictions • Involves analyzing existing data or samples • Provides basic knowledge • Examples – Studying the surface of Venus – Determining the nucleotide sequence of DNA – Using data previously collected for heart disease and reanalyzing it for a related disease
Slide49References1. Kleinsteuber, et al., Natural Science 5 th edition , King’s College, PA, 2004. 2. Lee, J.A., The Scientific Endeavor , Addison Wesley Longman, CA, 2000. 3. Ben-Ari, Just a Theory : Exploring the Nature of Science, Prometheus Books, Amherst, NY, 2005. 4. References individually cited