Prediction of Performance of Simple Gas Turbines
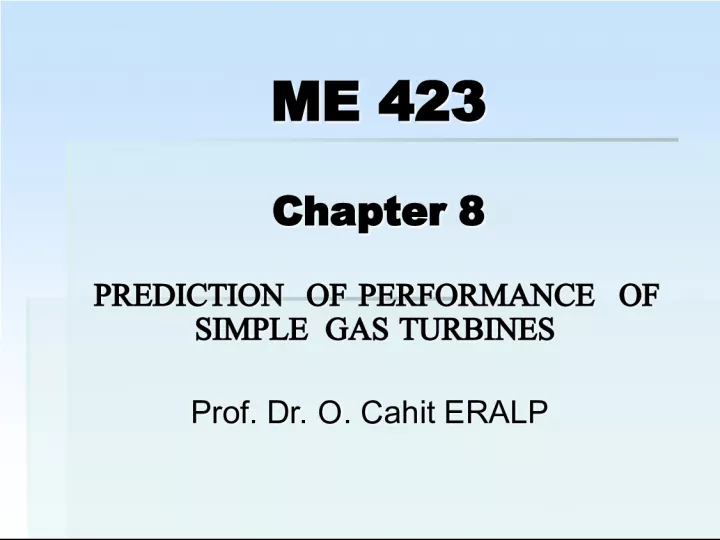

This article discusses the prediction of performance of simple gas turbines through cycle calculations and design data selection. It also highlights the importance of designing individual components to achieve the required operation at the design point.
- Uploaded on | 0 Views
-
 demarion
About Prediction of Performance of Simple Gas Turbines
PowerPoint presentation about 'Prediction of Performance of Simple Gas Turbines'. This presentation describes the topic on This article discusses the prediction of performance of simple gas turbines through cycle calculations and design data selection. It also highlights the importance of designing individual components to achieve the required operation at the design point.. The key topics included in this slideshow are gas turbines, performance prediction, cycle calculations, design data selection, individual components design,. Download this presentation absolutely free.
Presentation Transcript
1. ME 423 Chapter 8 PREDICTION OF PERFORMANCE OF SIMPLE GAS TURBINES ME 423 Chapter 8 PREDICTION OF PERFORMANCE OF SIMPLE GAS TURBINES Prof. Dr. O. Cahit ERALP Prof. Dr. O. Cahit ERALP
2. Prediction of Performance for GT Prediction of Performance for GT Me 423 Spring 2006 Prof. Dr. O. Cahit ERALP From cycle calculations it is possible to determine the PRESSURE RATIO ( R c ) w hich will give the best overall efficiency for a given T max . From cycle calculations it is possible to determine the PRESSURE RATIO ( R c ) w hich will give the best overall efficiency for a given T max . MASS FLOW RATE to give the most suitable desired power output. MASS FLOW RATE to give the most suitable desired power output. After such preliminary calculations, the most suitable design data for a particular application can be chosen. After such preliminary calculations, the most suitable design data for a particular application can be chosen. Then, it is possible to design individual components to give the required operation at the design point. Then, it is possible to design individual components to give the required operation at the design point. That is running at the design speed N*, mass flow rate m* and pressure ratio R*. That is running at the design speed N*, mass flow rate m* and pressure ratio R*. Prediction of Performance of Simple Gas Turbine Prediction of Performance of Simple Gas Turbine
3. Prediction of Performance for GT Prediction of Performance for GT Me 423 Spring 2006 Prof. Dr. O. Cahit ERALP Then the off-design performance has to be determined which is the divergence from the design point over the complete operating range of speed and power output. Then the off-design performance has to be determined which is the divergence from the design point over the complete operating range of speed and power output. The performance of the individual components may be estimated on the basis of the previous experience or actual experiments . When they are combined in an engine their operating range is considerably reduced. The performance of the individual components may be estimated on the basis of the previous experience or actual experiments . When they are combined in an engine their operating range is considerably reduced. The problem is to find the Operating point (OP) on each component when the engine is running at a steady speed ( EQUILIBRIUM ). The problem is to find the Operating point (OP) on each component when the engine is running at a steady speed ( EQUILIBRIUM ). The plot of these OP's form the EQUILIBRIUM RUNNING LINE (ERL). The plot of these OP's form the EQUILIBRIUM RUNNING LINE (ERL). Prediction of Terformance of Simple Gas Turbine Prediction of Terformance of Simple Gas Turbine
4. Prediction of Performance for GT Prediction of Performance for GT Me 423 Spring 2006 Prof. Dr. O. Cahit ERALP For the whole range of operating speeds, it will generate the EQUILIBRIUM RUNNING DIAGRAM . For the whole range of operating speeds, it will generate the EQUILIBRIUM RUNNING DIAGRAM . Determining the OP; the power output, thrust and the SFC can be obtained. Determining the OP; the power output, thrust and the SFC can be obtained. The Equilibrium Running Diagram indicates the margin of operation from the surge line (SL) . The Equilibrium Running Diagram indicates the margin of operation from the surge line (SL) . This margin indicates a Margin of stability; indicates if there is enough margin to operate with adequate compressor efficiency. This margin indicates a Margin of stability; indicates if there is enough margin to operate with adequate compressor efficiency. If the surge line is crossed some action has to be taken to recover, not to give rise to a failure. If the surge line is crossed some action has to be taken to recover, not to give rise to a failure. Ideally the engine should be operated within the region of maximum possible efficiencies . Ideally the engine should be operated within the region of maximum possible efficiencies . Prediction of Performance of Simple Gas Turbine Prediction of Performance of Simple Gas Turbine
5. Prediction of Performance for GT Prediction of Performance for GT Me 423 Spring 2006 Prof. Dr. O. Cahit ERALP Variation of SFC with reduction in power PART LOAD PERFORMANCE. This is important wh ile running the GT at low power settings. Variation of SFC with reduction in power PART LOAD PERFORMANCE. This is important wh ile running the GT at low power settings. Poor sfc at part load is the biggest disadvantage of a GT, especially a vehicular one. Poor sfc at part load is the biggest disadvantage of a GT, especially a vehicular one. The effect of ambient conditions on maximum output is also important, i.e. high & low T a and P a . The effect of ambient conditions on maximum output is also important, i.e. high & low T a and P a . Peak load energy generation: Peak load energy generation: Europe: cold days in winter, Europe: cold days in winter, America: hot days in Summer America: hot days in Summer for airplanes: Runway length (safety) and for airplanes: Runway length (safety) and pay l oad (economics) are affected. pay l oad (economics) are affected. Prediction of Performance of Simple Gas Turbine Prediction of Performance of Simple Gas Turbine
6. Prediction of Performance for GT Prediction of Performance for GT Me 423 Spring 2006 Prof. Dr. O. Cahit ERALP Off-Design Performance of Simple GT Off-Design Performance of Simple GT Here we will try to analy s e a : a) Single shaft unit delivering shaft power. b) Free turbine engine - power turbine drives the load. c) Simple jet engine, where the useful output is from the propelling nozzle. Here we will try to analy s e a : a) Single shaft unit delivering shaft power. b) Free turbine engine - power turbine drives the load. c) Simple jet engine, where the useful output is from the propelling nozzle. More comp l ex arrangements - two spool engines, Turbofan & transient performance Chapter 9 More comp l ex arrangements - two spool engines, Turbofan & transient performance Chapter 9 Flow characteristics of a free turbine and propelling nozzle are similar and impose the same restrictions on the Gas Generator. Flow characteristics of a free turbine and propelling nozzle are similar and impose the same restrictions on the Gas Generator. As a result of this several jet engines have been converted to Free Turbine Power engine for peak load electric generation, and marine applications. As a result of this several jet engines have been converted to Free Turbine Power engine for peak load electric generation, and marine applications.
7. Prediction of Performance for GT Prediction of Performance for GT Me 423 Spring 2006 Prof. Dr. O. Cahit ERALP Component Character i st i cs Component Character i st i cs FIG.1 Compressor Characteristics Axial compressor constant speed lines become vertical so c , R c vs is plotted. Axial compressor constant speed lines become vertical so c , R c vs is plotted.
8. Prediction of Performance for GT Prediction of Performance for GT Me 423 Spring 2006 Prof. Dr. O. Cahit ERALP Component Character i st i cs Component Character i st i cs FIG. 2 Turbine Characteristics Turbine do not show a significant variation in ND speed. Their operating range is usually severely restricted by another component downstream. Turbine do not show a significant variation in ND speed. Their operating range is usually severely restricted by another component downstream.
9. Prediction of Performance for GT Prediction of Performance for GT Me 423 Spring 2006 Prof. Dr. O. Cahit ERALP Since inlet and exhaust pressure losses are ignored; pressure ratio across the turbine is determined by the compressor pressure ratio and the pressure loss in the combustion chamber; Since inlet and exhaust pressure losses are ignored; pressure ratio across the turbine is determined by the compressor pressure ratio and the pressure loss in the combustion chamber; P 034 = P 012 - P 032 The mass flow through the turbine = mass flow through the compressor - Bleeds + fuel flow; The mass flow through the turbine = mass flow through the compressor - Bleeds + fuel flow; Off-Design Operation o f The Single - Shaft G T Off-Design Operation o f The Single - Shaft G T
10. Prediction of Performance for GT Prediction of Performance for GT Me 423 Spring 2006 Prof. Dr. O. Cahit ERALP a) Select a constant speed line on the C and choose an OP on this line thus a) Select a constant speed line on the C and choose an OP on this line thus N/ T 01 are selected. N/ T 01 are selected. b) The corresponding point on the T is obtained by the Compatibility of Speed and Flow. b) The corresponding point on the T is obtained by the Compatibility of Speed and Flow. COMPATIBILITY OF ROTATIONAL SPEED COMPATIBILITY OF ROTATIONAL SPEED Procedure of Obta i n i ng an Equ i l i br i um Runn i ng Po i nt Procedure of Obta i n i ng an Equ i l i br i um Runn i ng Po i nt
11. Prediction of Performance for GT Prediction of Performance for GT Me 423 Spring 2006 Prof. Dr. O. Cahit ERALP COMPATIBILITY OF FLOW COMPATIBILITY OF FLOW Here combustion chamber pressure loss Here combustion chamber pressure loss P 03 /P 02 = 1 - P b /P 02 P 03 /P 02 = 1 - P b /P 02 assume assume Procedure of Obta i n i ng an Equ i l i br i um Runn i ng Po i nt Procedure of Obta i n i ng an Equ i l i br i um Runn i ng Po i nt
12. Prediction of Performance for GT Prediction of Performance for GT Me 423 Spring 2006 Prof. Dr. O. Cahit ERALP Procedure of Obta i n i ng an Equ i l i br i um Runn i ng Po i nt Procedure of Obta i n i ng an Equ i l i br i um Runn i ng Po i nt are fixed by the chosen OP on the are fixed by the chosen OP on the is assumed to be constant. is assumed to be constant. Neglecting inlet and exhaust pressure losses P a = P 01 = P 04 Neglecting inlet and exhaust pressure losses P a = P 01 = P 04 is a function of is a function of and and
13. Prediction of Performance for GT Prediction of Performance for GT Me 423 Spring 2006 Prof. Dr. O. Cahit ERALP Procedure of Obta i n i ng an Equ i l i br i um Runn i ng Po i nt Procedure of Obta i n i ng an Equ i l i br i um Runn i ng Po i nt Now in the flow compatibility the only unknown is Now in the flow compatibility the only unknown is The rest can be obtained from C and T. The rest can be obtained from C and T. Thus, Thus, Thus, knowing T 01 , T 03 can be calculated. Thus, knowing T 01 , T 03 can be calculated.
14. Prediction of Performance for GT Prediction of Performance for GT Me 423 Spring 2006 Prof. Dr. O. Cahit ERALP Procedure of Obta i n i ng an Equ i l i br i um Runn i ng Po i nt Procedure of Obta i n i ng an Equ i l i br i um Runn i ng Po i nt Having determined T 03 , the SPEED COMPATIBILITY : Having determined T 03 , the SPEED COMPATIBILITY : The compressor & turbine temperature changes can be determined. The compressor & turbine temperature changes can be determined.
15. Prediction of Performance for GT Prediction of Performance for GT Me 423 Spring 2006 Prof. Dr. O. Cahit ERALP Procedure of Obta i n i ng an Equ i l i br i um Runn i ng Po i nt Procedure of Obta i n i ng an Equ i l i br i um Runn i ng Po i nt And the NET POWER corresponding to selected OP is : And the NET POWER corresponding to selected OP is : m could be calcul a ted knowing P 01 , T 01 m could be calcul a ted knowing P 01 , T 01 c) Having matched the C & T it is necessary to ascertain whether the work output corresponding to the OP is compatible with that required by the driven load. c) Having matched the C & T it is necessary to ascertain whether the work output corresponding to the OP is compatible with that required by the driven load. For this; variation of power with speed " P (N)" should be known. This will indicate whether the OP selected represents a valid solution (Equilibrium). For this; variation of power with speed " P (N)" should be known. This will indicate whether the OP selected represents a valid solution (Equilibrium).
16. Prediction of Performance for GT Prediction of Performance for GT Me 423 Spring 2006 Prof. Dr. O. Cahit ERALP Procedure of Obta i n i ng an Equ i l i br i um Runn i ng Po i nt Procedure of Obta i n i ng an Equ i l i br i um Runn i ng Po i nt Examples: Examples: If the engine were run on a test bed, Coupled to an electric/or hydraulic dynamometer, the load could be set independent of speed. Then, it is possible to operate at any point on C within safety limits (T 03 , N). If the engine were run on a test bed, Coupled to an electric/or hydraulic dynamometer, the load could be set independent of speed. Then, it is possible to operate at any point on C within safety limits (T 03 , N). With a Propeller load - Power absorbed varies with as N 3 of propeller. Knowing and gear ratio, the load characteristics in terms of P out turbine vs N turbine can be plotted which corresponds to a single P output per constant speed curve i.e single p oint on a fixed C. With a Propeller load - Power absorbed varies with as N 3 of propeller. Knowing and gear ratio, the load characteristics in terms of P out turbine vs N turbine can be plotted which corresponds to a single P output per constant speed curve i.e single p oint on a fixed C. Only at this point the required output is given. Only at this point the required output is given.
17. Prediction of Performance for GT Prediction of Performance for GT Me 423 Spring 2006 Prof. Dr. O. Cahit ERALP Procedure of Obta i n i ng an Equ i l i br i um Runn i ng Po i nt Procedure of Obta i n i ng an Equ i l i br i um Runn i ng Po i nt FIG.3 Load Characteristics FIG.3 Load Characteristics
18. Prediction of Performance for GT Prediction of Performance for GT Me 423 Spring 2006 Prof. Dr. O. Cahit ERALP Procedure of Obta i n i ng an Equ i l i br i um Runn i ng Po i nt Procedure of Obta i n i ng an Equ i l i br i um Runn i ng Po i nt Then the single point on each constant speed line of the C has to be found. Then the single point on each constant speed line of the C has to be found. This is done by trial error, taking several OP on the C and establishing the power output for each OP. This is done by trial error, taking several OP on the C and establishing the power output for each OP. If the power output by turbine is not equal to power required by propeller then the engine will not be in equilibrium but accelerate or decelerate. If the power output by turbine is not equal to power required by propeller then the engine will not be in equilibrium but accelerate or decelerate. Finding the equilibrium points on a series of constant speed lines, and joining them the equilibrium running line is obtained. Finding the equilibrium points on a series of constant speed lines, and joining them the equilibrium running line is obtained. The most common type of load used with a single shaft GT is the ELECTRIC GENERATOR which runs at constant N with the electrical load varying . The most common type of load used with a single shaft GT is the ELECTRIC GENERATOR which runs at constant N with the electrical load varying .
19. Prediction of Performance for GT Prediction of Performance for GT Me 423 Spring 2006 Prof. Dr. O. Cahit ERALP Procedure of Obta i n i ng an Equ i l i br i um Runn i ng Po i nt Procedure of Obta i n i ng an Equ i l i br i um Runn i ng Po i nt Then the single point on each constant speed line of the C has to be found. Then the single point on each constant speed line of the C has to be found. This is done by trial error, taking several OP on the C and establishing the power output for each OP. This is done by trial error, taking several OP on the C and establishing the power output for each OP. If the power output by turbine is not equal to power required by propeller then the engine will not be in equilibrium but accelerate or decelerate. If the power output by turbine is not equal to power required by propeller then the engine will not be in equilibrium but accelerate or decelerate. Finding the equilibrium points on a series of constant speed lines, and joining them the equilibrium running line is obtained. Finding the equilibrium points on a series of constant speed lines, and joining them the equilibrium running line is obtained. The most common type of load used with a single shaft GT is the ELECTRIC GENERATOR which runs at constant N with the electrical load varying . The most common type of load used with a single shaft GT is the ELECTRIC GENERATOR which runs at constant N with the electrical load varying .
20. Prediction of Performance for GT Prediction of Performance for GT Me 423 Spring 2006 Prof. Dr. O. Cahit ERALP Procedure of Obta i n i ng an Equ i l i br i um Runn i ng Po i nt Procedure of Obta i n i ng an Equ i l i br i um Runn i ng Po i nt FIG.4 Equiblirium Running Lines FIG.4 Equiblirium Running Lines
21. Prediction of Performance for GT Prediction of Performance for GT Me 423 Spring 2006 Prof. Dr. O. Cahit ERALP Procedure of Obta i n i ng an Equ i l i br i um Runn i ng Po i nt Procedure of Obta i n i ng an Equ i l i br i um Runn i ng Po i nt The equilibrium running line for a generator set would correspond to a particular line of constant The equilibrium running line for a generator set would correspond to a particular line of constant Each point on the line would represent a different value of T 03 and P out . Each point on the line would represent a different value of T 03 and P out . At each speed it is possible to find by trial error the compressor OP corresponding to zero net output and connecting the N o -L oad R unning L ine for a Generator Set is obtained. At each speed it is possible to find by trial error the compressor OP corresponding to zero net output and connecting the N o -L oad R unning L ine for a Generator Set is obtained. Looking at the C and propeller equilibrium line, the operation is generally at a high c . Looking at the C and propeller equilibrium line, the operation is generally at a high c .
22. Prediction of Performance for GT Prediction of Performance for GT Me 423 Spring 2006 Prof. Dr. O. Cahit ERALP Procedure of Obta i n i ng an Equ i l i br i um Runn i ng Po i nt Procedure of Obta i n i ng an Equ i l i br i um Runn i ng Po i nt Generator load results in a rapid drop in c as the load is reduced. Generator load results in a rapid drop in c as the load is reduced. The location of equilibrium running line w . r . t . surge line indicates whether it could be brought to full power without any complications. The location of equilibrium running line w . r . t . surge line indicates whether it could be brought to full power without any complications. If ERL and SL intersects a blow-off valve around the compressor rear is employed. No such problem for bringing up an electric generator (No load condition). If ERL and SL intersects a blow-off valve around the compressor rear is employed. No such problem for bringing up an electric generator (No load condition). With the above findings T 032 and hence from Combustion curves, f could be determined for an assumed b With the above findings T 032 and hence from Combustion curves, f could be determined for an assumed b then, sfc can be calculated. then, sfc can be calculated.
23. Prediction of Performance for GT Prediction of Performance for GT Me 423 Spring 2006 Prof. Dr. O. Cahit ERALP Example on single shaft gas turbine Example on single shaft gas turbine The following data refer to a SSGT operating at design speed: The following data refer to a SSGT operating at design speed: Ambient conditions:P a =1.013 bar, T a =288 K, m =98% Ambient conditions:P a =1.013 bar, T a =288 K, m =98% (Neglect all pressure losses!) (Neglect all pressure losses!) Calculate: T 03 for Power=3800 kW Calculate: T 03 for Power=3800 kW 1) Establish the T 03 for each point given on the CC 1) Establish the T 03 for each point given on the CC 2) Establish (T 02 - T 01 ), (T 03 - T 04 ) and find P out 2) Establish (T 02 - T 01 ), (T 03 - T 04 ) and find P out 3) Plot T 03 vs P out to find the T 03 for P out =3800 kW 3) Plot T 03 vs P out to find the T 03 for P out =3800 kW
24. Prediction of Performance for GT Prediction of Performance for GT Me 423 Spring 2006 Prof. Dr. O. Cahit ERALP Example on single shaft gas turbine Example on single shaft gas turbine 1) 1)
25. Prediction of Performance for GT Prediction of Performance for GT Me 423 Spring 2006 Prof. Dr. O. Cahit ERALP Equ i l i br i um Runn i ng of a Gas Generator Equ i l i br i um Runn i ng of a Gas Generator The GG performs the same function for both the jet engine and free turbine engine. The GG performs the same function for both the jet engine and free turbine engine. It generates continuous flow of gas at high pressure and temperature, to be expanded to lower pressure to produce either shaft work or a high vel ocity propulsive jet. It generates continuous flow of gas at high pressure and temperature, to be expanded to lower pressure to produce either shaft work or a high vel ocity propulsive jet. The compatibility of speed and flow are the same as the single shaft engine. The compatibility of speed and flow are the same as the single shaft engine. Thus; Thus;
26. Prediction of Performance for GT Prediction of Performance for GT Me 423 Spring 2006 Prof. Dr. O. Cahit ERALP Equ i l i br i um Runn i ng of a Gas Generator Equ i l i br i um Runn i ng of a Gas Generator However, the pressure ratio of the turbine is not known. However, the pressure ratio of the turbine is not known. It must be determined by equating the turbine work to the compressor work. It must be determined by equating the turbine work to the compressor work. The work requirement; The work requirement; These eq uatio ns are linked by (T 03 /T 01 ) and a trial-and - error procedure is necessary to determine T 03 for any arbitrary point on C These eq uatio ns are linked by (T 03 /T 01 ) and a trial-and - error procedure is necessary to determine T 03 for any arbitrary point on C
27. Prediction of Performance for GT Prediction of Performance for GT Me 423 Spring 2006 Prof. Dr. O. Cahit ERALP Equ i l i br i um Runn i ng of a Gas Generator Equ i l i br i um Runn i ng of a Gas Generator a) Select a comp. OP a) Select a comp. OP b) Calculate b) Calculate c) Guess a value of P 03 /P 01 & calculate c) Guess a value of P 03 /P 01 & calculate d) Find T 03 / T 01 from FLOW compatibility d) Find T 03 / T 01 from FLOW compatibility e) Using T 03 / T 01 calculate from SPEED COMPATIBILITY e) Using T 03 / T 01 calculate from SPEED COMPATIBILITY
28. Prediction of Performance for GT Prediction of Performance for GT Me 423 Spring 2006 Prof. Dr. O. Cahit ERALP Equ i l i br i um Runn i ng of a Gas Generator Equ i l i br i um Runn i ng of a Gas Generator f) With and P 03 / P 04 find c from T f) With and P 03 / P 04 find c from T g) Calculate g) Calculate h) Calculate (T 03 /T 01 ) using ( T 034 /T 03 ) and POWER h) Calculate (T 03 /T 01 ) using ( T 034 /T 03 ) and POWER COMPATIBILITY COMPATIBILITY i) Check T 03 /T 01 with the "one" from flow compatibility (Step d ) i) Check T 03 /T 01 with the "one" from flow compatibility (Step d ) j) If different modify P 03 /P 04 and repeat the steps c to i until obtaining the correct T 03 /T 01 j) If different modify P 03 /P 04 and repeat the steps c to i until obtaining the correct T 03 /T 01
29. Prediction of Performance for GT Prediction of Performance for GT Me 423 Spring 2006 Prof. Dr. O. Cahit ERALP Equ i l i br i um Runn i ng of a Gas Generator Equ i l i br i um Runn i ng of a Gas Generator k ) The agreement of T 03 /T 01 indicates that the turbine OP is compatible with the compressor OP for the temperature increase in CC satisfying T 03 /T 01 . k ) The agreement of T 03 /T 01 indicates that the turbine OP is compatible with the compressor OP for the temperature increase in CC satisfying T 03 /T 01 . It is not necessary to calculate this for a series of points because the downstream components impose limits on the operating zone of the C. It is not necessary to calculate this for a series of points because the downstream components impose limits on the operating zone of the C. This could be repeated for a series of points and points of constant T 03 /T 01 could be joined up, but unnecessary since the flow compatibility with the downstream components (power turbine/or/ propelling nozzle restricts the operating zone on the C. This could be repeated for a series of points and points of constant T 03 /T 01 could be joined up, but unnecessary since the flow compatibility with the downstream components (power turbine/or/ propelling nozzle restricts the operating zone on the C.
30. Prediction of Performance for GT Prediction of Performance for GT Me 423 Spring 2006 Prof. Dr. O. Cahit ERALP Equ i l i br i um Runn i ng of a Gas Generator Equ i l i br i um Runn i ng of a Gas Generator The matching procedure outlined here has been developed on the assumption that turbine do not exhibit a variation of with The matching procedure outlined here has been developed on the assumption that turbine do not exhibit a variation of with This is t rue if the flow correspond to choked mass flows. This is t rue if the flow correspond to choked mass flows. If not choked ; before g uessing P 03 / P 04 If not choked ; before g uessing P 03 / P 04 *Guess T 03 /T 01 calculate N / T 03 from speed compatibility *Guess T 03 /T 01 calculate N / T 03 from speed compatibility *calculate from flow compatibility *calculate from flow compatibility * Then P 03 / P 04 and t can be obtained from T * Then P 03 / P 04 and t can be obtained from T * T 034 /T 03 can be calculated and the GG work compatibility T 03 /T 01 * T 034 /T 03 can be calculated and the GG work compatibility T 03 /T 01 * Compare T 03 /T 01 with the initial guess. * Compare T 03 /T 01 with the initial guess.
31. Prediction of Performance for GT Prediction of Performance for GT Me 423 Spring 2006 Prof. Dr. O. Cahit ERALP
32. Prediction of Performance for GT Prediction of Performance for GT Me 423 Spring 2006 Prof. Dr. O. Cahit ERALP Off-des i gn Operat i on of Free Turb i ne Eng i ne Off-des i gn Operat i on of Free Turb i ne Eng i ne The matching is done by select a point on C. The matching is done by select a point on C. i) Flow compatibility i.e mass flow of GG = mass flow FT i) Flow compatibility i.e mass flow of GG = mass flow FT where where ii) The pressure ratio available is fixed by the compressor and GGT press ratios. ii) The pressure ratio available is fixed by the compressor and GGT press ratios. Inlet and e xit duct losses ignored . Inlet and e xit duct losses ignored .
33. Prediction of Performance for GT Prediction of Performance for GT Me 423 Spring 2006 Prof. Dr. O. Cahit ERALP Off-des i gn Operat i on of Free Turb i ne Eng i ne Off-des i gn Operat i on of Free Turb i ne Eng i ne iii) Having found the pressure ratio across the power Turbine, the value of can be found from the FT . iii) Having found the pressure ratio across the power Turbine, the value of can be found from the FT . iv) If from (i) and (iii) do not match; a new point on the constant speed C has to be selected and this procedure has to be repeated until the flow compatibility between 2 turbines is satisfied . iv) If from (i) and (iii) do not match; a new point on the constant speed C has to be selected and this procedure has to be repeated until the flow compatibility between 2 turbines is satisfied . For each line on the C there will be only one point which will satisfy both the requirement of the GG and the flow compatibility of the FT. For each line on the C there will be only one point which will satisfy both the requirement of the GG and the flow compatibility of the FT.
34. Prediction of Performance for GT Prediction of Performance for GT Me 423 Spring 2006 Prof. Dr. O. Cahit ERALP Off-des i gn Operat i on of Free Turb i ne Eng i ne Off-des i gn Operat i on of Free Turb i ne Eng i ne Equilibrium running line can be produced for different Equilibrium running line can be produced for different on C. The running line for the FT engine is independent of the load and determined by the swallowing capacity ( ) of the PT. on C. The running line for the FT engine is independent of the load and determined by the swallowing capacity ( ) of the PT. FT engine has quite a different load performance than the single shaft GT. FT engine has quite a different load performance than the single shaft GT.
35. Prediction of Performance for GT Prediction of Performance for GT Me 423 Spring 2006 Prof. Dr. O. Cahit ERALP Off-des i gn Operat i on of Free Turb i ne Eng i ne Off-des i gn Operat i on of Free Turb i ne Eng i ne FIG.5 Equilirium Running Line for Free Turbine FIG.5 Equilirium Running Line for Free Turbine
36. Prediction of Performance for GT Prediction of Performance for GT Me 423 Spring 2006 Prof. Dr. O. Cahit ERALP Matching of 2 TURBINES IN SERIES Matching of 2 TURBINES IN SERIES The iterative procedure of a FT/GG matching can be simplified if the 2-Turbines in series are considered. The iterative procedure of a FT/GG matching can be simplified if the 2-Turbines in series are considered. The variation of t at any pressure ratio is not large, particularly in the restricted range of operation. As a result the change in t does not affect so has a little effect on The variation of t at any pressure ratio is not large, particularly in the restricted range of operation. As a result the change in t does not affect so has a little effect on Therefore, a mean value of t is taken at any given pressure ratio. Then, Therefore, a mean value of t is taken at any given pressure ratio. Then, Now the GG turbine exit conditions can be mapped on the GGT. Now the GG turbine exit conditions can be mapped on the GGT.
37. Prediction of Performance for GT Prediction of Performance for GT Me 423 Spring 2006 Prof. Dr. O. Cahit ERALP Off-des i gn Operat i on of Free Turb i ne Eng i ne Off-des i gn Operat i on of Free Turb i ne Eng i ne FIG . 6 Operation of Turbines in Series FIG . 6 Operation of Turbines in Series
38. Prediction of Performance for GT Prediction of Performance for GT Me 423 Spring 2006 Prof. Dr. O. Cahit ERALP Off-des i gn Operat i on of Free Turb i ne Eng i ne Off-des i gn Operat i on of Free Turb i ne Eng i ne The flow compatibility between the 2 turbines places a major restriction on the OP of GGT. The flow compatibility between the 2 turbines places a major restriction on the OP of GGT. As long as the PT is choked, the GGT will operate at a fixed ND point at all choked OP. As long as the PT is choked, the GGT will operate at a fixed ND point at all choked OP. With the PT unchoked the GG will operate at a fixed pressure ratio for each PT pressure ratio (i.e. fixed OP) With the PT unchoked the GG will operate at a fixed pressure ratio for each PT pressure ratio (i.e. fixed OP) Thus the maximum pressure ratio across the GGT is controlled by choking PT. (i.e the SWALLOWING capacity the GT). Thus the maximum pressure ratio across the GGT is controlled by choking PT. (i.e the SWALLOWING capacity the GT). The turbine pressure ratios can be expressed in terms of the R c as: The turbine pressure ratios can be expressed in terms of the R c as:
39. Prediction of Performance for GT Prediction of Performance for GT Me 423 Spring 2006 Prof. Dr. O. Cahit ERALP Off-des i gn Operat i on of Free Turb i ne Eng i ne Off-des i gn Operat i on of Free Turb i ne Eng i ne FIG. 7 Compressor Pressure Ratio vs GGT Pressure Ratio FIG. 7 Compressor Pressure Ratio vs GGT Pressure Ratio For any value of the compressor pressure ratio, GGT pressure ratio can be obtained . Thus and T 034 /T 03 are fixed for GG flow compatibility & GG power compatibility. Thus f or the GG , pressure ratio iteration is not necessary to find the correct equilibrium point. For any value of the compressor pressure ratio, GGT pressure ratio can be obtained . Thus and T 034 /T 03 are fixed for GG flow compatibility & GG power compatibility. Thus f or the GG , pressure ratio iteration is not necessary to find the correct equilibrium point.
40. Prediction of Performance for GT Prediction of Performance for GT Me 423 Spring 2006 Prof. Dr. O. Cahit ERALP Variation o f Power Output & Sfc w ith Output Speed o f a F ree Turbine Engine Variation o f Power Output & Sfc w ith Output Speed o f a F ree Turbine Engine Power output of a FT engine = C pg T 045 Power output of a FT engine = C pg T 045 where where FIG.8 Variation of P ower O utput with O utput Speed FIG.8 Variation of P ower O utput with O utput Speed
41. Prediction of Performance for GT Prediction of Performance for GT Me 423 Spring 2006 Prof. Dr. O. Cahit ERALP Variation Of Power Output & s fc w ith Output Speed o f a F ree Turbine Engine Variation Of Power Output & s fc w ith Output Speed o f a F ree Turbine Engine power output f or each equilibrium running point (one for each compressor speed); power output f or each equilibrium running point (one for each compressor speed); i) P 04 /P a will be known i) P 04 /P a will be known ii) T 04 can be calculated from T 04 = T 03 - T 034 knowing P a , T a ; m can be found from ii) T 04 can be calculated from T 04 = T 03 - T 034 knowing P a , T a ; m can be found from Free turbines are used to drive a variety of loads each of which are different (pump, propeller, electric generator), each with different vs N pt .These curves are quite flat in the higher N pt region where pt is fairly constant. Free turbines are used to drive a variety of loads each of which are different (pump, propeller, electric generator), each with different vs N pt .These curves are quite flat in the higher N pt region where pt is fairly constant.
42. Prediction of Performance for GT Prediction of Performance for GT Me 423 Spring 2006 Prof. Dr. O. Cahit ERALP Variation Of Power Output & s fc w ith Output Speed o f a F ree Turbine Engine Variation Of Power Output & s fc w ith Output Speed o f a F ree Turbine Engine s fc increases as power is reduced, since as fuel flow decreases ; N c decreases , T 03 decreases; but as T 03 decreases cycle decreases. s fc increases as power is reduced, since as fuel flow decreases ; N c decreases , T 03 decreases; but as T 03 decreases cycle decreases. FIG.9 Variation o f s fc With Power Outpu t FIG.9 Variation o f s fc With Power Outpu t
43. Prediction of Performance for GT Prediction of Performance for GT Me 423 Spring 2006 Prof. Dr. O. Cahit ERALP Variation o f Power Output & s fc w ith Output Speed o f a F ree Turbine Engine Variation o f Power Output & s fc w ith Output Speed o f a F ree Turbine Engine Fuel consumption can be calculated similar to the single shaft units since the fuel consumption depends only on GG parameters. There will be one value for each Fuel consumption can be calculated similar to the single shaft units since the fuel consumption depends only on GG parameters. There will be one value for each . s fc however , is a function of both N c and N pt as P out . s fc however , is a function of both N c and N pt as P out The off-design performance can be expressed by plotting sfc vs P out for different N pt . This shows the performance of the unit when coupled to different types of loads. The off-design performance can be expressed by plotting sfc vs P out for different N pt . This shows the performance of the unit when coupled to different types of loads. Although for convenience N comp is chosen as the independent variable ; i n practice the fuel flow is the independent variable. A chosen value of fuel flow and (T 03 ) determines N comp and therefore P out . Although for convenience N comp is chosen as the independent variable ; i n practice the fuel flow is the independent variable. A chosen value of fuel flow and (T 03 ) determines N comp and therefore P out .
44. Prediction of Performance for GT Prediction of Performance for GT Me 423 Spring 2006 Prof. Dr. O. Cahit ERALP Torque Character i st i cs Torque Character i st i cs In case of a GT delivering shaft power, the variation of torque with output speed at a given power determines its suitability for different applications (e.g. h igh starting torque for traction). In case of a GT delivering shaft power, the variation of torque with output speed at a given power determines its suitability for different applications (e.g. h igh starting torque for traction). a) For the single shaft engine the compressor is constrained to turn at some multiple of load speed. a) For the single shaft engine the compressor is constrained to turn at some multiple of load speed. Load speed decrease = Compressor speed decrease unsuitable for traction (since m decrease out decrease) Load speed decrease = Compressor speed decrease unsuitable for traction (since m decrease out decrease) b) Normal curve of Internal Combustion Engine is flat . b) Normal curve of Internal Combustion Engine is flat . c) Free power turbine has a favourable torque over a wide load-speed range for a fixed N c . This is because the compressor can supply an essentially constant flow at a given compressor speed irrespective of the FT speed. c) Free power turbine has a favourable torque over a wide load-speed range for a fixed N c . This is because the compressor can supply an essentially constant flow at a given compressor speed irrespective of the FT speed.
45. Prediction of Performance for GT Prediction of Performance for GT Me 423 Spring 2006 Prof. Dr. O. Cahit ERALP Torque Character i st i cs Torque Character i st i cs Therefore, Therefore, at constant P out as N pt decrease in crease . at constant P out as N pt decrease in crease . The torque might stall at high or very low N pt . The torque might stall at high or very low N pt . With a reduction in N pt quite a large increase in can be obtained efficiently. With a reduction in N pt quite a large increase in can be obtained efficiently. But at least a speed gear box have to be used for traction (usually 5-6 speed automatic transmission is used in heavy load vehicles) But at least a speed gear box have to be used for traction (usually 5-6 speed automatic transmission is used in heavy load vehicles)
46. Prediction of Performance for GT Prediction of Performance for GT Me 423 Spring 2006 Prof. Dr. O. Cahit ERALP Torque Character i st i cs Torque Character i st i cs FIG.10 Torque Characteristics FIG.10 Torque Characteristics
47. Prediction of Performance for GT Prediction of Performance for GT Me 423 Spring 2006 Prof. Dr. O. Cahit ERALP Given: Given: Example on gas turbine with Free Power Turbine Example on gas turbine with Free Power Turbine Calculate: Calculate: Power developed and the turbine ND flows Power developed and the turbine ND flows If the engine is running at same mechanical speed at ambient temp. of 268 K, calculate T 03 , P 0 3 / P 0 4 and P out assuming the following: If the engine is running at same mechanical speed at ambient temp. of 268 K, calculate T 03 , P 0 3 / P 0 4 and P out assuming the following: a)Combustion pressure loss remains constant. a)Combustion pressure loss remains constant.
48. Prediction of Performance for GT Prediction of Performance for GT Me 423 Spring 2006 Prof. Dr. O. Cahit ERALP Example on Gas Turbine with Free Power Turbine Example on Gas Turbine with Free Power Turbine b)Both turbines are choking with values of and as calculated above. No change in b)Both turbines are choking with values of and as calculated above. No change in c)At 268 K and the same N, the line on the C is a vertical line with ND flow 5% greater than the design value. c)At 268 K and the same N, the line on the C is a vertical line with ND flow 5% greater than the design value. d)Variation of compressor efficiency with pressure ratio at the relevant value of is: d)Variation of compressor efficiency with pressure ratio at the relevant value of is: P 0 2 / P 0 1 P 0 2 / P 0 1 6.0 6.0 6.2 6.2 6.4 6.4 6.6 6.6 0.873 0.873 0.843 0.843 0.845 0.845 0.840 0.840
49. Prediction of Performance for GT Prediction of Performance for GT Me 423 Spring 2006 Prof. Dr. O. Cahit ERALP Example on gas turbine with Free Power Turbine Example on gas turbine with Free Power Turbine Solution: Solution: Design Point Calculation: Design Point Calculation: OP on CC: OP on CC:
50. Prediction of Performance for GT Prediction of Performance for GT Me 423 Spring 2006 Prof. Dr. O. Cahit ERALP Example on Gas Turbine with Free Power Turbine Example on Gas Turbine with Free Power Turbine GG GG Power Turbine: Power Turbine:
51. Prediction of Performance for GT Prediction of Performance for GT Me 423 Spring 2006 Prof. Dr. O. Cahit ERALP Example on Gas Turbine with Free Power Turbine Example on Gas Turbine with Free Power Turbine
52. Prediction of Performance for GT Prediction of Performance for GT Me 423 Spring 2006 Prof. Dr. O. Cahit ERALP Example on gas turbine with Free Power Turbine Example on gas turbine with Free Power Turbine OFF DESIGN OFF DESIGN At T a = T 01 =268K At T a = T 01 =268K If the PT remains choked, the GGT will be constrained to operate at a fixed ND point and thus the value of If the PT remains choked, the GGT will be constrained to operate at a fixed ND point and thus the value of as for the design condition as for the design condition The Work Compatibility:
53. Prediction of Performance for GT Prediction of Performance for GT Me 423 Spring 2006 Prof. Dr. O. Cahit ERALP Example on gas turbine with Free Power Turbine Example on gas turbine with Free Power Turbine hence hence Flow Compatibility Now the problem is to find the OP that satisfies A and B simultaneously for With the variation in efficiency;
54. Prediction of Performance for GT Prediction of Performance for GT Me 423 Spring 2006 Prof. Dr. O. Cahit ERALP Example on gas turbine with Free Power Turbine Example on gas turbine with Free Power Turbine With the constant value of CC loss Iterations Tabulated :
55. Prediction of Performance for GT Prediction of Performance for GT Me 423 Spring 2006 Prof. Dr. O. Cahit ERALP Example on gas turbine with Free Power Turbine Example on gas turbine with Free Power Turbine With the constant value of CC loss Iterations Tabulated:
56. Prediction of Performance for GT Prediction of Performance for GT Me 423 Spring 2006 Prof. Dr. O. Cahit ERALP Example on gas turbine with Free Power Turbine Example on gas turbine with Free Power Turbine Solving Graphically the required pressure ratio : Solving Graphically the required pressure ratio : P 0 2 / P 0 1 = 6.41 with T 0 3 / T 0 1 = 4.34 P 0 2 / P 0 1 = 6.41 with T 0 3 / T 0 1 = 4.34 Therefore; T o3 = 4.34*268=1163K Therefore; T o3 = 4.34*268=1163K P developed can be calculated; P developed can be calculated; since the GGT still operates at the same ND point since the GGT still operates at the same ND point
57. Prediction of Performance for GT Prediction of Performance for GT Me 423 Spring 2006 Prof. Dr. O. Cahit ERALP Example on gas turbine with Free Power Turbine Example on gas turbine with Free Power Turbine Power output Power output P = 32.7kg/s* 1.147J/kg.K*179,6K*0,99= 6680kW P = 32.7kg/s* 1.147J/kg.K*179,6K*0,99= 6680kW Thus on a cold day a decrease of T amb to T o1 =268K results in a decrease of max. cycle temperature from 1200K to 1163K. Thus on a cold day a decrease of T amb to T o1 =268K results in a decrease of max. cycle temperature from 1200K to 1163K. T 03 /T 01 increases from 4.17 to 4.34 due to the increased T 03 /T 01 increases from 4.17 to 4.34 due to the increased Power increases from 5910 to 6680 kW. This is due to increase of mass flow rate and compressor pressure ratio. Power increases from 5910 to 6680 kW. This is due to increase of mass flow rate and compressor pressure ratio. The beneficial effect of low T a on GT is evident also the adverse effect of increase of T a . The beneficial effect of low T a on GT is evident also the adverse effect of increase of T a .
58. Prediction of Performance for GT Prediction of Performance for GT Me 423 Spring 2006 Prof. Dr. O. Cahit ERALP Off Des i gn Operat i on Of The Jet Eng i n e Propell i ng Nozzle Character i st i cs Off Des i gn Operat i on Of The Jet Eng i n e Propell i ng Nozzle Character i st i cs The propelling nozzle area is determined from the design point calculations. The propelling nozzle area is determined from the design point calculations. A fixed nozzle area has a major influence on the A fixed nozzle area has a major influence on the off-design operation. off-design operation. The nozzle in terms of ND variables is given in terms of and P 04 /P a The nozzle in terms of ND variables is given in terms of and P 04 /P a
59. Prediction of Performance for GT Prediction of Performance for GT Me 423 Spring 2006 Prof. Dr. O. Cahit ERALP Propell i ng Nozzle Character i st i cs Propell i ng Nozzle Character i st i cs For a nozzle of given area and j For a nozzle of given area and j These are valid up to the critical point. These are valid up to the critical point. The CRITICAL point of the nozzle is when The CRITICAL point of the nozzle is when
60. Prediction of Performance for GT Prediction of Performance for GT Me 423 Spring 2006 Prof. Dr. O. Cahit ERALP Propell i ng Nozzle Character i st i cs Propell i ng Nozzle Character i st i cs FIG.1 1 Propell i ng Nozzle Character i st i cs FIG.1 1 Propell i ng Nozzle Character i st i cs
61. Prediction of Performance for GT Prediction of Performance for GT Me 423 Spring 2006 Prof. Dr. O. Cahit ERALP Propell i ng Nozzle Character i st i cs Propell i ng Nozzle Character i st i cs for P 04 /P a > P 04 /P c , the nozzle is choked P 5 = P c > P a and for P 04 /P a > P 04 /P c , the nozzle is choked P 5 = P c > P a and = const (not a function of P 04 /P a ). = const (not a function of P 04 /P a ). The similarity between this and the turbine is evident. The similarity between this and the turbine is evident. When the nozzle is choked When the nozzle is choked Generally Generally
62. Prediction of Performance for GT Prediction of Performance for GT Me 423 Spring 2006 Prof. Dr. O. Cahit ERALP Matching of GG with Nozzle Matching of GG with Nozzle The Nozzle will exert the same restriction on the operation of the GG as the FT, at STATIC conditions, The Nozzle will exert the same restriction on the operation of the GG as the FT, at STATIC conditions, T he equilibrium running line can be determined as for FT. Here the effect of forward speed (V a ) on the equilibrium running line has to be considered. T he equilibrium running line can be determined as for FT. Here the effect of forward speed (V a ) on the equilibrium running line has to be considered. F ORWARD SPEED F ORWARD SPEED RAM PRESSURE RATIO = f(M a , i ) RAM PRESSURE RATIO = f(M a , i ) RAM P 02 increase P 04 increase P 04 /P 5 increase RAM P 02 increase P 04 increase P 04 /P 5 increase when choked maximum and independent of P 04 /P 45 thus V a . when choked maximum and independent of P 04 /P 45 thus V a .
63. Prediction of Performance for GT Prediction of Performance for GT Me 423 Spring 2006 Prof. Dr. O. Cahit ERALP Matching of GG with Nozzle Matching of GG with Nozzle Then the Turbine OP will be unchanged because of the compatibility of flow between turbine & nozzle. Then the Turbine OP will be unchanged because of the compatibility of flow between turbine & nozzle. That is; As long as the nozzle is choked , the equilibrium running line is uniquely determined by the fixed Turbine OP and independent of flight speed. That is; As long as the nozzle is choked , the equilibrium running line is uniquely determined by the fixed Turbine OP and independent of flight speed. Practically ALL JET ENGINES during take off, climb and cruise operate with Choked Nozzle. Practically ALL JET ENGINES during take off, climb and cruise operate with Choked Nozzle. The nozzle may be unchoked when preparing to land or taxying. The nozzle may be unchoked when preparing to land or taxying. Since the running line is close to surge line at low , the effect of V a on ERL has to be considered. Since the running line is close to surge line at low , the effect of V a on ERL has to be considered.
64. Prediction of Performance for GT Prediction of Performance for GT Me 423 Spring 2006 Prof. Dr. O. Cahit ERALP Matching of GG with Nozzle Matching of GG with Nozzle Nozzle pressure ratio and Ram pressure ratio can be related as : Nozzle pressure ratio and Ram pressure ratio can be related as : The ram pressure ratio is : The ram pressure ratio is : Therefore, for a given intake efficiency i ; Therefore, for a given intake efficiency i ; P 04 /P a = f (GG parameters and flight Mach Number). P 04 /P a = f (GG parameters and flight Mach Number). *The same procedure as for the FPT can be followed to obtain the equilibrium running point. *The same procedure as for the FPT can be followed to obtain the equilibrium running point.
65. Prediction of Performance for GT Prediction of Performance for GT Me 423 Spring 2006 Prof. Dr. O. Cahit ERALP Matching of GG with Nozzle Matching of GG with Nozzle FIG. 12 Jet Engine Running Lines FIG. 12 Jet Engine Running Lines
66. Prediction of Performance for GT Prediction of Performance for GT Me 423 Spring 2006 Prof. Dr. O. Cahit ERALP Matching of GG with Nozzle Matching of GG with Nozzle F or each compressor speed the calculation is repeated for several M a to cover the desired range of flight speed. F or each compressor speed the calculation is repeated for several M a to cover the desired range of flight speed. The result A fan of E quilibrium RL of constant M a . The result A fan of E quilibrium RL of constant M a . These merge to a single RL at higher , where the nozzle is choked. These merge to a single RL at higher , where the nozzle is choked. Increasing M a pushes the equilibrium RL away from SL at low compressor speeds. Increasing M a pushes the equilibrium RL away from SL at low compressor speeds. Therefore, the Ram pressure rise allows the R c decrease for the required flow. Therefore, the Ram pressure rise allows the R c decrease for the required flow.
67. Prediction of Performance for GT Prediction of Performance for GT Me 423 Spring 2006 Prof. Dr. O. Cahit ERALP Var i at i on of Thrust W i th Rotat i onal-speed; Forward-speed; Alt i tude Var i at i on of Thrust W i th Rotat i onal-speed; Forward-speed; Alt i tude The Net Thrust of the jet is; The Net Thrust of the jet is; F = m (V 5 -V a ) + (P 5 -P a ) A 5 F = m (V 5 -V a ) + (P 5 -P a ) A 5 F net over the complete range of inlet conditions F net over the complete range of inlet conditions (V a , ) is determined by ND quantities as : (V a , ) is determined by ND quantities as : Since : Since :
68. Prediction of Performance for GT Prediction of Performance for GT Me 423 Spring 2006 Prof. Dr. O. Cahit ERALP Var i at i on of Thrust W i th Rotat i onal-speed; Forward-speed; Alt i tude Var i at i on of Thrust W i th Rotat i onal-speed; Forward-speed; Alt i tude When the Nozzle is UNCHOKED; When the Nozzle is UNCHOKED; with P 5 = P a and the pressure thrust is 0 since P 5 / P a = 1 with P 5 = P a and the pressure thrust is 0 since P 5 / P a = 1 When the Nozzle is CHOKED; When the Nozzle is CHOKED; and and where the critical pressure ratio , P c / P 04 : where the critical pressure ratio , P c / P 04 :
69. Prediction of Performance for GT Prediction of Performance for GT Me 423 Spring 2006 Prof. Dr. O. Cahit ERALP Var i at i on of Thrust W i th Rotat i onal-speed; Forward-speed; Alt i tude Var i at i on of Thrust W i th Rotat i onal-speed; Forward-speed; Alt i tude FIG.13 Variation of Thrust (F/ Pa ) with engine speed (N/ T01) and flight speed (Ma)
70. Prediction of Performance for GT Prediction of Performance for GT Me 423 Spring 2006 Prof. Dr. O. Cahit ERALP Var i at i on of Thrust W i th Rotat i onal-speed; Forward-speed; Alt i tude Var i at i on of Thrust W i th Rotat i onal-speed; Forward-speed; Alt i tude There ; There ; The thrust for a given N/ T 01 = f (Ma) ; The thrust for a given N/ T 01 = f (Ma) ; although for choked flow there is a UNIQUE ERL. although for choked flow there is a UNIQUE ERL. I ncreasing flight speed V a , m * V a = momentum drag increases P 02 increases (i.e RAM increases ) I ncreasing flight speed V a , m * V a = momentum drag increases P 02 increases (i.e RAM increases ) At low N/ T 01 , momentum drag increase predominates thus M a increases F n decreases . At low N/ T 01 , momentum drag increase predominates thus M a increases F n decreases . At high N/ T 01 , Ram pressure rise predominates Thus M a increases F n increases At high N/ T 01 , Ram pressure rise predominates Thus M a increases F n increases
71. Prediction of Performance for GT Prediction of Performance for GT Me 423 Spring 2006 Prof. Dr. O. Cahit ERALP ENGINE SPEED ENGINE SPEED A lthough performance is expressed in terms of ND speed, N/ T 01 , the actual mechanical speed N imposes a limit due to turbine stres s es, and controlled. A lthough performance is expressed in terms of ND speed, N/ T 01 , the actual mechanical speed N imposes a limit due to turbine stres s es, and controlled. If the speed is kept well below this limit, the take-off thrust is sub s tantially reduced. If the speed is kept well below this limit, the take-off thrust is sub s tantially reduced. If N exceeds the correct limit : If N exceeds the correct limit : i) The centrifugal stresses increase with the square of speed N 2 i) The centrifugal stresses increase with the square of speed N 2 ii) A rapid increase in Turbine Inlet Temperature T 03 (2% in N may cause 50 K in T 03 ) ii) A rapid increase in Turbine Inlet Temperature T 03 (2% in N may cause 50 K in T 03 )
72. Prediction of Performance for GT Prediction of Performance for GT Me 423 Spring 2006 Prof. Dr. O. Cahit ERALP ENGINE SPEED ENGINE SPEED Since the blade life is determined by CREEP, the time which the high speeds are permitted must be controlled. Since the blade life is determined by CREEP, the time which the high speeds are permitted must be controlled. Take-off rating t < 5 min 100% N max Take-off rating t < 5 min 100% N max Climb rating - reduction in fuel flow t < 30 min Climb rating - reduction in fuel flow t < 30 min at 98 % N max at 98 % N max Cruise rating - further reduction in fuel and Cruise rating - further reduction in fuel and rotor speed at 95 % N max rotor speed at 95 % N max
73. Prediction of Performance for GT Prediction of Performance for GT Me 423 Spring 2006 Prof. Dr. O. Cahit ERALP Effect of Ambient Conditions on the take off rating Effect of Ambient Conditions on the take off rating T a : With Engine running at max speed, T a , N/ T a T a : With Engine running at max speed, T a , N/ T a hence N/ T 01 , hence N/ T 01 , along the equ i librium running line ; along the equ i librium running line ; Therefore, T a Fn ( loss of thrust) Therefore, T a Fn ( loss of thrust) T 03 T 03 = ( T 03 / T 01 )*T 01 T 03 T 03 = ( T 03 / T 01 )*T 01 On a hot day T 03 > T 03max N is required, thus Fn On a hot day T 03 > T 03max N is required, thus Fn
74. Prediction of Performance for GT Prediction of Performance for GT Me 423 Spring 2006 Prof. Dr. O. Cahit ERALP Effect of Ambient Conditions on the take off rating Effect of Ambient Conditions on the take off rating P a : F n and P a in direct proportion (since (F / Pa) ... ) P a : F n and P a in direct proportion (since (F / Pa) ... ) A ltitude , P a and Ta ( up to 11000 m) A ltitude , P a and Ta ( up to 11000 m) since as P a F n since as P a F n but as T a F n Then F n but as T a F n Then F n Therefore ; thrust decreases with increase in altitude. Therefore ; thrust decreases with increase in altitude. Airports at high altitudes, especially around tropical zones are critical (Mexico - City, Nairobi ) suffer from this problem. Airports at high altitudes, especially around tropical zones are critical (Mexico - City, Nairobi ) suffer from this problem.
75. Prediction of Performance for GT Prediction of Performance for GT Me 423 Spring 2006 Prof. Dr. O. Cahit ERALP Variation in fuel consumption & sfc with rotational Speed, forward speed & altitude Variation in fuel consumption & sfc with rotational Speed, forward speed & altitude Fuel consumption and fuel capacity of the aircraft determine the range Fuel consumption and fuel capacity of the aircraft determine the range sfc (fuel flow /per unit thrust) indicates economy sfc (fuel flow /per unit thrust) indicates economy Both are functions of N/ T 01 and M a . Both are functions of N/ T 01 and M a . With combustion efficiency b assumed, With combustion efficiency b assumed, f uel consumption can be determined from : f uel consumption can be determined from : m, f/a curves, with T 032 . m, f/a curves, with T 032 .
76. Prediction of Performance for GT Prediction of Performance for GT Me 423 Spring 2006 Prof. Dr. O. Cahit ERALP Variation in fuel consumption & sfc with rotational Speed, forward speed & altitude Variation in fuel consumption & sfc with rotational Speed, forward speed & altitude Dependence of fuel flow on Ambient conditions can be eliminated by ND fuel flow Dependence of fuel flow on Ambient conditions can be eliminated by ND fuel flow The fuel parameter slightly depends on M a when based on T 01 and P 01 . They merge to a single line, for the choked nozzle conditions. The fuel parameter slightly depends on M a when based on T 01 and P 01 . They merge to a single line, for the choked nozzle conditions.
77. Prediction of Performance for GT Prediction of Performance for GT Me 423 Spring 2006 Prof. Dr. O. Cahit ERALP Variation in fuel consumption & sfc with rotational Speed, forward speed & altitude Variation in fuel consumption & sfc with rotational Speed, forward speed & altitude FIG. 14 S.f.c. Curves FIG. 14 S.f.c. Curves
78. Prediction of Performance for GT Prediction of Performance for GT Me 423 Spring 2006 Prof. Dr. O. Cahit ERALP Methods of Displacing the E quilibrium R unning L ine Methods of Displacing the E quilibrium R unning L ine If the Equilibrium Running Line (ERL) intersects the Surge Line (SL), it is not possible to bring the engine up to full power directly. If the Equilibrium Running Line (ERL) intersects the Surge Line (SL), it is not possible to bring the engine up to full power directly. The compressor may surge when the engine accelerates even ERL is not cutting the SL. The compressor may surge when the engine accelerates even ERL is not cutting the SL. Many high performance compressors have a kink in the SL. Many high performance compressors have a kink in the SL. A running line intersecting SL at low N/ T 01 and at the kink is shown in F igu re 15. A running line intersecting SL at low N/ T 01 and at the kink is shown in F igu re 15. To overcome ERL is lowered down in dangerous regions. To overcome ERL is lowered down in dangerous regions.
79. Prediction of Performance for GT Prediction of Performance for GT Me 423 Spring 2006 Prof. Dr. O. Cahit ERALP Methods of Displacing the equilibrium running line Methods of Displacing the equilibrium running line BLOW-OFF is a method to achieve this. BLOW-OFF is a method to achieve this. Air is bled from some intermediate compressor stage. Air is bled from some intermediate compressor stage. Some turbine work is wasted. Some turbine work is wasted. blow-off valve only operates when it is essential . blow-off valve only operates when it is essential . Variable Area Propelling Nozzle; an alternative method to blow-off. Variable Area Propelling Nozzle; an alternative method to blow-off. Either method will produce a reduction in P 02 /P 01 at a given N/ T 01 , hence lower the ERL. Either method will produce a reduction in P 02 /P 01 at a given N/ T 01 , hence lower the ERL.
80. Prediction of Performance for GT Prediction of Performance for GT Me 423 Spring 2006 Prof. Dr. O. Cahit ERALP Methods of Displacing the equilibrium running line Methods of Displacing the equilibrium running line FIG. 15 Effect of Blow-off and Increased Nozzle Area FIG. 15 Effect of Blow-off and Increased Nozzle Area
81. Prediction of Performance for GT Prediction of Performance for GT Me 423 Spring 2006 Prof. Dr. O. Cahit ERALP Methods of Displacing the equilibrium running line Methods of Displacing the equilibrium running line FIG. 16 Effect of Variable Area Propelling Nozzle FIG. 16 Effect of Variable Area Propelling Nozzle
82. Prediction of Performance for GT Prediction of Performance for GT Me 423 Spring 2006 Prof. Dr. O. Cahit ERALP Methods of Displacing the equilibrium running line Methods of Displacing the equilibrium running line In a variable area nozzle as nozzle area increases, A 5 increases (P 03 /P 04 ,so P 03 4 /T 03 ). In a variable area nozzle as nozzle area increases, A 5 increases (P 03 /P 04 ,so P 03 4 /T 03 ). If N/ T 01 is held constant P 02 /P 01 . If N/ T 01 is held constant P 02 /P 01 . Therefore, RL will be moved away from SL. T o keep N/ T 01 constant fuel flow to be reduced. Therefore, RL will be moved away from SL. T o keep N/ T 01 constant fuel flow to be reduced. for N/ T 01 held constant and A 5 ; for N/ T 01 held constant and A 5 ; ERL will be removed away from SL. ERL will be removed away from SL.
