Parts of a Hurricane

This article explores the different parts of a hurricane and their characteristics. The name of hurricanes in different parts of the world, such as the Atlantic Ocean, Indian Ocean, China Sea, and Australia, are also
- Uploaded on | 5 Views
-
 gudo
gudo
About Parts of a Hurricane
PowerPoint presentation about 'Parts of a Hurricane'. This presentation describes the topic on This article explores the different parts of a hurricane and their characteristics. The name of hurricanes in different parts of the world, such as the Atlantic Ocean, Indian Ocean, China Sea, and Australia, are also. The key topics included in this slideshow are . Download this presentation absolutely free.
Presentation Transcript
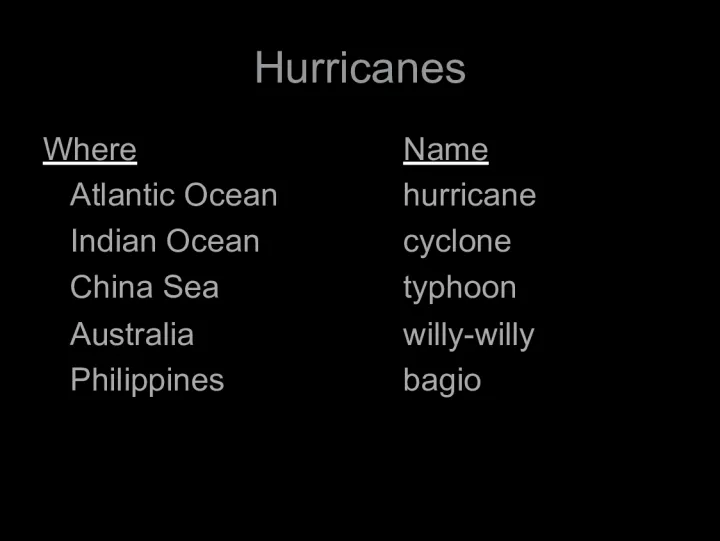
Slide1HurricanesWhere Name Atlantic Ocean hurricane Indian Ocean cyclone China Sea typhoon Australia willy-willy Philippines bagio
Slide2Parts of a Hurricane• Eye – in the center, very calm winds, very low air pressure • Eye wall – surrounds the eye, highest wind speeds occur here; winds lift air at over 1 million tons per second • Spiral bands - Bands of rain clouds that spiral counter-clockwise (typical hurricane 6 – 12 in. of rain) • Storm Surge – hurricane winds push ocean water toward shore causing ocean level to rise higher than the average tide; responsible for 9 of every 10 deaths in a hurricane
Slide3Hurricanes
Slide4The Life of a Hurricane• Step 1 – The sun heats the ocean to 80 ◦ F or more. • Step 2 – A lot of water evaporates, filling the air up to 3 miles from the surface with water vapor. • Step 3 – Warm, moist air rises and cool air rushes in to create high winds. Clouds can reach 50,000 ft. • Step 4 – Winds spiral toward the storm center.
Slide5Life of a Hurricane• Step 5 – Steady upper level winds blowing in the same direction move the storm. As long as warm water and winds continue to feed it, the storm keeps growing. – Tropical Depression if wind speeds are less than 39 mph – Tropical Storm is given a name when the wind speed reaches 39 – 73 mph – Hurricane when winds reach 74 mph • Step 6 – Once a hurricane reaches cooler water or land, it weakens and dies. (The longest lived hurricane lasted 29 days.)
Slide6Beaufort Wind Scale• The Beaufort Wind Scale is a system used to estimate and report wind speeds when no measuring apparatus is available. • It was invented in the early 19th Century by Admiral Sir Francis Beaufort of the British Navy as a way to interpret winds from conditions at sea. • Since that time, the scale has been modernized for effects on land. • http://www.spc.noaa.gov/faq/tornado/beaufort.ht ml
Slide7Question…• How fast must the wind speeds be in order to classify a storm as a hurricane? • A. 36mph • B. 72mph • C. 74mph • D. 76mph
Slide8Question…• How fast must the wind speeds be in order to classify a storm as a hurricane? • A. 36mph • B. 72mph • C. 74mph • D. 76mph
Slide9Energy in a Hurricane• Every gram of water (1 ml) releases 540 calories of heat as it condenses. • As warm, tropical air rises and condenses, huge amounts of energy flow into the hurricane. • A typical hurricane releases more energy in one hour than an atomic bomb. • The combined nuclear arsenals of the US and Russia do not have enough power to match one day during a hurricane.
Slide10Hurricane Names for 2014• Arthur Bertha Cristobal Dolly Edouard Fay Gonzalo Hanna Isaias Josephine Kyle Laura Marco Nana Omar Paulette Rene Sally Teddy Vicky Wilfred
Slide11Number of Tropical Cyclones per 100 Years
Slide12June
Slide13July
Slide14August
Slide15September
Slide16October
Slide17November
Slide18Question…• What is the most popular month for Hurricanes to occur? Why?
Slide19Hurricanes that impact us form offof the western coast of Africa.
Slide20How many hit NJ?
Slide22What are the chances of being hit again?
Slide23Question…• Why don’t we experience more powerful hurricanes in New Jersey?
Slide24Saffir Simpson Hurricane Scale• The Saffir-Simpson Hurricane Scale ranks hurricanes from 1-5 based on intensity to give an estimate of the potential property damage and flooding expected from landfall. • Wind speed is the determining factor in the scale. • Storm surge values are highly dependent on the slope of the continental shelf and the shape of the coastline in the landfall region.
Slide25Only 3 Category Five Hurricanes have madelandfall in the United States since records began: – The Labor Day Hurricane - 1935 struck the Florida Keys with a minimum pressure of 892 mb, the lowest pressure ever observed in the United States. – Hurricane Camille in 1969 struck the Mississippi Gulf Coast causing a 25-foot storm surge – Hurricane Andrew in August, 1992 crossed Florida into the Gulf of Mexico and turned north to hit Louisiana. It had the 3 rd lowest pressures ever seen. – By comparison, hurricane Katrina was a category 3 when it struck the US Gulf Coast.
Slide26Top 5 Deadliest Hurricanes• 1900, category 4, TX • 1928, category 4, FL • 1919, category 4, FL and TX • 1938, category 3, New England • 1935, category 5, FL • What do you notice about all of these dates? Why is that significant?
Slide27Top 5 Costliest Hurricanes• 2005 Katrina, category 3, $81 billion, LA • 2012 Sandy, Extra Tropical, $53 billion, NY, NJ • 1992 Andrew, category 4, $30.5 billion, FL, LA • 1989 Hugo, category 4, $8.5 billion, SC • 1972 Agnes, category 1, $7.5 billion, FL, northeastern US • 1965 Betsy, category 3, $7.4 billion, FL – Famous hurricane names are “retired.”
Slide28Hurricane Safety• Hurricane Watch – a hurricane is possible within 36 hours – Prepare flashlights, radio, extra batteries, first aid kit, and fill gas tank of the car. Stock up on canned goods, store extra water and medicines. Tie down or bring in any loose items. Bring in pets.
Slide29Hurricane Safety• Hurricane Warning – a hurricane is likely to hit within 24 hours – Tape Xs across small windows to prevent flying glass. Board up large windows. Fill the bath tub with water. Turn fridge to the coldest setting. Evacuate mobile homes. Go to a shelter if told to. Head for higher ground. Flooding occurs before the hurricane arrives! Stay away from windows. Do not go outside in the eye of the storm. Don’t touch downed power lines. Be on the lookout for poisonous snakes that have been driven from their homes by the flood.
Slide30Dr. Nail vs. the Monster• Ed Sutt: “In house after house, I noticed that it wasn’t the wood that had failed—it was the nails that held the wood together.” • “Homeowners and insurance companies are going to love these nails but contractors are going to hate them, because when they make mistakes, it’s not a trivial thing to remove them. Once you nail something together, it’s going to stay together.”
Slide31Benefits of Hurricanes• Japan gets ¼ of its rain from typhoons. • Strong winds, heavy rains and large waves create ideal conditions for some marine animals by exposing food along the shoreline. • Churning waters dredge up nutrients and algae from sediment at the bottom that then gather at the surface, presenting a feast. • Shrimp produce more offspring when the salinity of the water is low, as it is after a hurricane. (oohh la la) • Hurricanes create more breeding grounds for the endangered birds, such as the piping plover.
Slide32Hurricane Tidbits• The hurricane of 1938 toppled 275 million trees, enough timber to build 200,000 five room houses. Its waves shook the earth so hard that they were registered by a seismograph 5000 miles away in Alaska. • Hurricane Beulah in 1967 spawned 141 tornadoes in TX. • Each cubic yard of water weighs 1700 pounds and hits with the force of a solid object, making the storm surge the deadliest part of a hurricane. A wave 50 feet long and 10 feet high has a weight of 80,000 pounds. Moving at 30 mph, it generates forward momentum of over 2 million pounds. • A hurricane eye can be 50 miles across. A hurricane can be 600 miles across; the average is 300 miles. It would take 6 hours to drive across the width of a hurricane. • Winds of 200 mph generate pressures of 152 pounds per square foot, or thirty tons of weight against the wall of a house.
Slide33More Hurricane Tidbits• In the Galveston storm, a 4 foot by 6 inch wooden board pierced the hull of a ship. The hull was made of iron plates 1 inch thick. • Sailors caught in the hurricane of 1837 had all of their nails turn black. Doctors believe that the sudden drop of air pressure may have caused their capillaries to rupture as they gripped the ship. • Some scientists believe that low air pressure allow faults to slip and create earthquakes during hurricanes. For example, a drop in air pressure would lessen the load on a square mile of land by 2 million tons. Followed by a increase in water depth from the storm surge that would increase the load by 9 million tons. The difference would be enough to fracture a fault line. This is the explanation given for the events in Japan in 1923.
Slide34Hurricane IreneAugust 20, 2011–August 28, 2011 Total fatalities : 56 ( In the US, 6 deaths due to storm surge/waves, or rip currents, 15 to wind, including falling trees, and 21 to floods .) Highest winds : 121 mph (195 km/h) Lowest pressure : 942 mb Category 3 Landfall: North Carolina, New Jersey, and New York The storm data is from NOAA's GOES-13 satellite. NASA - Hurricane Season 2011: Hurricane Irene (Atlantic Ocean)
Slide38Irene causedflooding from the Carolinas to the northeastern states. The heaviest rainfall totals of over 225 mm (~8.9 inches) were located in North Carolina where Irene first made landfall. Very heavy rainfall resulting in flooding was also evident in the TRMM rainfall map in northeastern states along the hurricane's track. 100 mm = 4 inches
Slide39The most severe impact of Irene in thenortheastern United States was catastrophic inland flooding from heavy rainfall in New Jersey, Massachusetts, and Vermont. Several record breaking crests on rivers were recorded.
Slide40A Nags Head, North Carolina , cottage built in 1903 was listed on the National Register of Historic Places. These are its owners.
Slide41Staten Island, NY
Slide42Lincoln Park, NJ
Slide43Paterson, NJ
Slide44Hightstown, NJ
Slide45Manville, NJ
Slide46•A storm surge of 3-5 ft along the New Jersey shores caused moderate to severe tidal flooding with extensive beach erosion. • A storm surge of 3-6 ft caused hundreds of millions of dollars in property damage in New York City and Long Island. • Power outages for up to 3 million residents lasted about 1 week, mainly across Connecticut and Long Island.
Slide47Cost of IreneThe Insurances Services Office reported that the hurricane caused an estimated $4.3 billion in losses. Doubling this figure in an attempt to account for uninsured losses results in an estimated total of $ 8.6 billion. Based on National Flood Insurance Program data, it is estimated that Irene caused $7.2 billion in losses from inland flooding and storm surge. Using these figures, the total damage estimate is $15.8 billion.
Slide48Hurricane Sandy
Slide49Hurricane Sandy• 650,000 homes damaged or destroyed • 8.5 million people without power • $50 billion in damages (2 nd only to Katrina) • F-0 tornado in Bermuda • 28 inches of rain in Jamaica and 13 inches in Maryland • 36 inches of snow in North Carolina and West Virginia • 147 people dead (72 in USA, of which 41 died due to the storm surge)
Slide50In New Jersey• tide 8.57 feet above normal in Sandy Hook may have been higher but station failed • deepest water 8.9 feet in Sandy Hook • Monmouth and Middlesex counties inundated with 4 – 9 feet of water • 5 million people without power • 346,000 housing units lost • 19,000 businesses lost • 48,000 trees lost • $4 billion to repair power, gas, sewer, waste, and water services
Slide51In New Jersey• Wildwood Crest 11.9 inches of rain • 65,000 boats lost • fishing industry devastated by loss of boats, docks, marinas, restaurants, and fish processing plants • $2.9 billion damage to roads, bridges, and transit systems • Salem Nuclear Power Plant shut down automatically when 4 of its 6 pumps failed
Slide52Before and afterimages of a portion of the coast in Mantoloking, NJ, showing the effect of storm surge flooding.
Slide53Before and afterimage of a portion of the coast near Rockaway, New York, in Queens County, showing the inland extent of storm surge flooding.
Slide54image of a rollercoaster sitting in the atlantic oceanin NJ after the Fun Town pier it sat on was destroyed by Sandy’s storm surge.
Slide55Storm surge penetrating the lower East Side inManhattan, New York City, on 29 October 2012
Slide56Lexington Avenue subway stationflooded during Sandy
Slide57surveillance camera photo shows a PATH station inHoboken, New Jersey as it is flooded around 9:30 p.m. footage