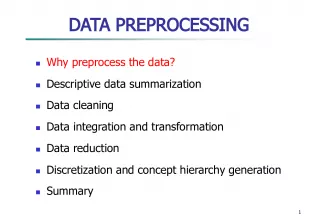
Exploring Statistics and Data Analysis: Mean, Median, Mode, and More

Statistics involves analyzing, interpreting, and presenting data to make informed decisions. This course delves into the calculation and application of statistical parameters, such as mean
- Uploaded on | 2 Views
-
 hiya
hiya
About Exploring Statistics and Data Analysis: Mean, Median, Mode, and More
PowerPoint presentation about 'Exploring Statistics and Data Analysis: Mean, Median, Mode, and More'. This presentation describes the topic on Statistics involves analyzing, interpreting, and presenting data to make informed decisions. This course delves into the calculation and application of statistical parameters, such as mean. The key topics included in this slideshow are . Download this presentation absolutely free.
Presentation Transcript
Slide1Statistics and Data(Algebraic)
Slide3Parameters and StatisticsMean, Median, and Mode The Five-Number Summary Boxplots Variance and Standard Deviation Normal Distributions … and why The language of statistics is becoming more commonplace in our everyday world.
Slide5The median of a list of n numbers { x 1 , x 2 ,…, x n } arranged in order (either ascending or descending) is the middle number if n is odd, and the mean of the two middle numbers if n is even.
Slide6The mode of a list of numbers is the number that appears most frequently in the list.
Slide7find the (a) mean, (b) median, and (c) mode of the data: 3, 6, 5, 7, 8, 10, 6, 2, 4, 6
Slide11A number in a data set can be considered anoutlier if it is more than 1.5 × IQR below the first quartile or above the third quartile.
Slide14if the data for a population are normally distributed withmean μ and standard deviation σ , then Approximately 68% of the data lie between μ - 1 σ and μ + 1 σ . Approximately 95% of the data lie between μ - 2 σ and μ + 2 σ . Approximately 99.7% of the data lie between μ - 3 σ and μ + 3 σ .
Slide16Text pg783/784 Exercises #2-26 (intervals of 4)