Introduction to the Science of Biology

This chapter introduces the reader to the fundamentals of the scientific method and the study of biology. It covers the basics of what science is, how it works, and how biology is a subset of science.
- Uploaded on | 0 Views
-
 islapacocha
About Introduction to the Science of Biology
PowerPoint presentation about 'Introduction to the Science of Biology'. This presentation describes the topic on This chapter introduces the reader to the fundamentals of the scientific method and the study of biology. It covers the basics of what science is, how it works, and how biology is a subset of science.. The key topics included in this slideshow are Science, Biology, Evidence, Natural World, Scientific Method,. Download this presentation absolutely free.
Presentation Transcript
1. Chapter 1: The Science of Biology
2. Section 1-1: What is Science
3. Thinking about the Nature of Science What is science? What makes science powerful? What characteristics must something have in order for it to be science? How does one do science?
4. What is Science? What is biology? Science an organized way of using evidence to learn about the natural world Biology the study of the living world
5. How Scientists Work What are your ideas about what specifically makes science the most powerful method we have for understanding nature?
6. How Scientists Work Using Scientific Method Ask a Question Form a Hypothesis Test the Hypothesis Analyze the Results Draw Conclusions Communicate Results
7. Scientific Method The Scientific Method = umbrella term for a variety of methods of study. All rigorous, systematic, evidence- based, and objective means of testing explanations of the natural world. Steps not the same order every time.
9. Ask a Question Scientists form questions when they observe nature through their senses (sight, hearing, touch, smell) Examples: Some peaches are juicy and sweet. Others are spongy with very little flavor. What makes some peaches juicier than others? My neighbor has thick, green grass. Mine is brown in spots and is thin. What does grass need to be healthy?
10. Ask a Question Practice Make observations and form a scientific question about the pictures below.
11. Form a Hypothesis Hypothesis a proposed explanation for a set of observations or possible answer to a question Must be testable, or its not scientific Write the hypothesis as a clear statement, do not say I think that . ATTENTION - It is okay for your hypothesis to be wrong! Never change your hypothesis after an experiment to make it correct. Prediction what you expect to observe . The data the experiment will produce if the hypothesis is correct Can be written as an If the hypothesis is correct, then statement.
12. Form a Hypothesis Example Hypothesis: Apples develop thicker skins as a defense against cold temperatures. Prediction: If apples are exposed to cool temperatures, then they will have thicker skin than other apples.
13. Form A Hypothesis Practice Write a possible hypothesis and prediction for each of the following observations. 1. The plants in Mr. Smiths living room are large, healthy and green but the plants in Mr. Smiths dining room are small and yellowish in color. 2. All of the fish in the classroom fish tank are healthy except for the algae eaters that keep dying.
14. Test the Hypothesis * Whenever possible, an experiment should be designed to have only ONE variable that is changed at a time. (AKA: Controlled Experiment) Controlled Variable/s the variable/s that are purposely kept the same Manipulated Variable the ONE variable that is deliberately changed (also called independent) Responding Variable the variable that is observed and that changes in response to the manipulated variable (also called dependent) Experimental Group the group in which the manipulated variable is changed Control or Control Group the group used as a standard for comparison for the experimental group
15. Test the Hypothesis Practice Hypothesis: Tomato plants given fertilizer will produce more tomatoes than plants that are not fertilized. Plant A Plant B * Both plants are given the same soil, amount of water and sun, temperature, pot size, and growth time. * Plant B is fertilized once a week. What are the controlled variables, the manipulated variable, and the responding variable? Which is the control and the experimental group?
16. Answers Controlled Variables soil, amount of water and sun, temperature, pot size, and growth time Manipulated Variable fertilizer Responding Variable # of tomatoes Control Plant A Experimental Group Plant B
17. Why change only one variable? Why did plant B grow more tomatoes? Its the only way to know which manipulated variable caused the responding variable to change. Plant B 7 hours of sunlight per day l L of water every 2 days gallon sized pot 35 C for 9 weeks fertilized once a week Plant A 5 hours of sunlight per day l L of water every 4 days quart sized pot 30 C for 6 weeks no fertilization Cant tell!
18. Test the Hypothesis Practice Describe why the experiment below is poorly designed. Write a prediction for the hypothesis and then re-design the experiment to make it better. Identify all variables and groups. Hypothesis: Bacteria exposed to antibiotics will be killed. Plate B Stored in incubator (35 C) Given ampicillin Stored in dark Given nutrients Plate A Stored on counter (22 C) Given penicillin Stored in light Not given nutrients
19. Analyze the Results All experimental data must include units. (examples: 9cm, 20sec, 98C) Tables and graphs are used to represent data and must be labeled with units and titles.
20. Analyze the Results Example Notice the table below has units and clear labels. Effect of Storage Temperature on Seed Germination Storage Temperature Inside 68F Outside 25F Outside 25F Germinated Seeds 0% 80% 85%
21. Representing Data in Graphs Storage Temperature F Germinated Seeds (%) 100 80 60 40 20 0 - Inside 68F - Inside 25F - Outside 25F Effects of Storage Temperature on Seed Germination
22. Analyze the Results Practice Add to the data table and graph to improve them. Hypothesis: Caffeine improves muscle performance. Prediction: Caffeinated frogs will jump farther than uncaffeinated frogs. Results: Frogs given caffeine jumped 27cm and frogs not given caffeine jumped 20 cm. Frog not given caffeine Frog given caffeine Distance of jump 20 27
23. Table needs units, labels, and title. Amount of Caffeine Distance of jump (cm) Graph needs a title, labels on X and Y axis, and a key. Effect of Caffeine on Frog Jumps Effect of Caffeine on Frog Jumps Amount of Caffeine No Caffeine Caffeine Distance of jump 20 cm 27 cm
24. Table needs units, labels and a title. Amount of Caffeine Distance of jump (cm) Graph needs a title, labels on X and Y axis, and a key. Effect of Caffeine on Frog Jumps Effect of Caffeine on Frog Jumps Amount of Caffeine No Caffeine Caffeine Distance of jump 20 cm 27 cm Uniform scale: every line stands for exactly 5 cm, no skips
25. Choosing Bar vs Line Graphs Bar graph = Used for groups/categories, Line graph = Comparing two number scales Manipulated variable on X-axis, responding variable on Y-axis
26. Graph Examples Number of students per town what kind of graph, bar or line? Town # of Students Canton 9 Stoughton 2 Norwood 1 Westwood 4 Dedham 3 Milton 2 Randolph 1 Sharon 1 Hyde Park 1
27. Graph Examples Number of students at different heights what kind of graph, bar or line? Height (cm) # of Students 150 2 151 2 152 3 153 6 154 5 155 3 156 1 157 1
28. Bar or Line Graph? Number of American Thrushes living in each of five forests 100 students choices for their favorite lunch Comparing the number of chromosomes to the number of genes The number of mates attracted by red vs yellow vs blue-beaked parrots The growth of a seedling (days old vs height)
29. Draw Conclusions Conclusion a final summation of experimental results A conclusions main purpose is to evaluate your initial ideas (hypothesis & prediction) using your data A conclusion should do the following:
30. Draw Conclusions (Add your own notes) 1. State the purpose in your own words . 2. Summarize the scientific idea the lab is about, and define any vocab words. 3. Restate the hypothesis and prediction, not copying exactly how they were already written . 4. Summarize (1-2 sentences) the procedure. 5. State whether the results support or refute the hypothesis/prediction. 6. Support the evaluation you made in step 5 with specific evidence (data). The average height in group A was 2 cm higher than group B. = Specific. Group A grew more. = Not specific. 7. Give a final concluding statement. If your hypothesis was supported , summarize that. If it was refuted , give a new and improved hypothesis.
31. Draw Conclusions Example Label the paragraph with numbers, marking where each of the 7 steps occurs: The experiment was designed to test whether caffeine would increase the distance frogs could jump. Caffeine is a stimulant. Stimulants are psychoactive drugs, meaning that they affect the nervous system. Jumping involves the nervous and muscular systems, so its possible that caffeine could affect jumping. It was hypothesized that caffeine improves muscle action, and it was predicted that the more caffeine a frog has, the farther it will jump. To test this, some frogs were given caffeine and others were not, and the lengths of their jumps were measured. The results supported the hypothesis and prediction, showing that frogs given caffeine jumped an average of 7cm farther than frogs that were not given caffeine. Caffeine does indeed increase the distance that frogs can jump.
32. Draw Conclusions Practice Examine the hypothesis and experimental results below, and write an appropriate conclusion. Hypothesis: Carrots require high nitrogen levels for best growth. Results: Effects of Nitrogen Levels on Carrot Growth Level of Nitrogen None Low High Average Carrot Length 6 in. 10 in. 4 in.
33. Communicate Results Scientists always report their results through journals and scientific papers. Allows others to repeat the investigation, skeptically evaluate the validity of the results, & can lead to further questions and investigations.
34. Scientific Language
35. Scientific Language The scientific process has a language of its own. Sometimes, this language diverges from conversational English. Science words can be different from English words even when they look exactly the same.
36. Scientific Language For example: the words for different kinds of scientific outcomes and models. In English, an observation is In Science, an observation is
37. Scientific Language Observation (Science definition): A data point gathered by one of the five senses. An example of an observation in science: After adding solution A to solution B, the mixture has a sharp sour smell.
38. Scientific Language Fact:
39. Scientific Language Fact (Science definition): An observation that has been made repeatedly. Example: Two negative poles move away from each other.
41. Scientific Language Law (Science definition): A mathematical description of patterns in a relationship between two quantities. Example: p + q = 1, (p + q) 2 (Hardy- Weinbergs Law)
42. Scientific Language Theory:
43. Scientific Language Theory (Science Definition): A powerful explanation of numerous natural phenomena. Example: Matter is made up of atoms, properties of matter come from atomic behavior (Atomic theory)
44. Section 1-3 Studying Life
45. Characteristics of Living Things made up of cells reproduce DNA grow and develop need materials and energy respond to the environment maintain a stable internal environment (homeostasis) evolve (as a group, change over time)
46. Living things are made up of cells. Cell a collection of living matter enclosed by a barrier separating the cell from its surroundings Cells are the smallest units of life in all organisms. Unicellular organisms single celled Multi-cellular organisms composed of more than one cell
47. Living things reproduce. Reproduction process where organisms produce new organisms or offspring Sexual Reproduction: two cells from different parents unite to produce first cell of new organism Asexual Reproduction: a single-celled organism divides in half to form two new organisms OR a portion of an organism splits off to form a new organism
48. Living things contain DNA. DNA (deoxyribonucleic acid) carries directions for inheritance. DNA determines the inherited traits of every organism on Earth.
49. Living things grow and develop. Growth getting larger in size Unicellular: cell gets bigger Multicellular: create more cells Development changes that occur during an organisms lifetime (life cycles)
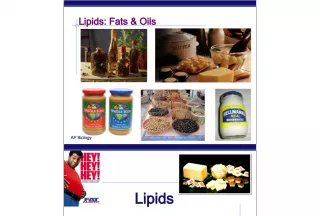
50. Living things need materials and energy. Metabolism : organisms chemical reactions building or breaking down materials Organisms vary in how they obtain energy: Autotrophs: capture energy from sun and convert it into food energy Heterotrophs: must take in food for energy
51. Living things respond to the environment. Organisms live in constantly changing environments (living and nonliving parts). Organisms respond or change to cope.
52. Living things maintain internal balance. Organisms maintain stable internal conditions (homeostasis) despite fluctuations in environment. temp, water content and food intake
53. Living things evolve over time. Populations of organisms evolve (change over time). Natural selection organisms that have certain favorable traits are better able to successfully reproduce than organisms that lack these traits