Understanding Variables and Data Analysis for Effective Decision Making

Learn about the classification of variables and the importance of context in data analysis. Master the three essential rules of data analysis and how to communicate your findings through effective visualization.
- Uploaded on | 10 Views
-
 jenni
jenni
About Understanding Variables and Data Analysis for Effective Decision Making
PowerPoint presentation about 'Understanding Variables and Data Analysis for Effective Decision Making'. This presentation describes the topic on Learn about the classification of variables and the importance of context in data analysis. Master the three essential rules of data analysis and how to communicate your findings through effective visualization.. The key topics included in this slideshow are Variables, Qualitative, Categorical, Quantitative, Data analysis, Context, Five Ws, Picture, Patterns, Visualization,. Download this presentation absolutely free.
Presentation Transcript
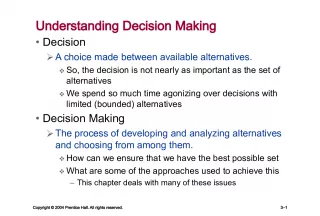
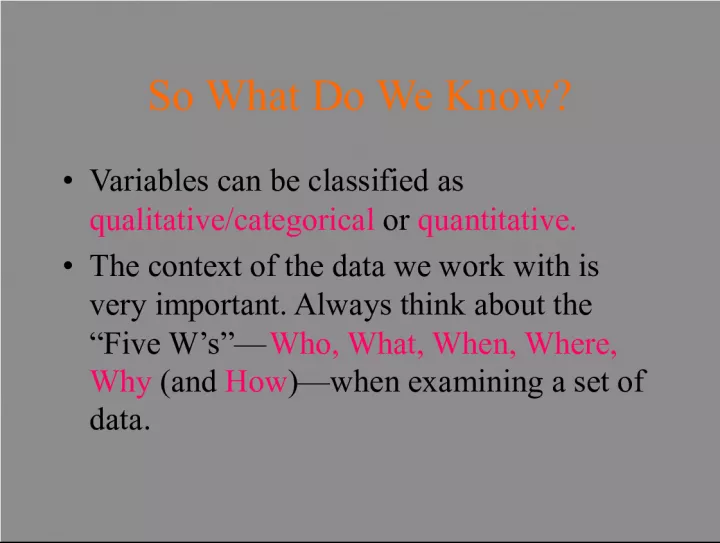
1. So What Do We Know? Variables can be classified as qualitative/categorical or quantitative. The context of the data we work with is very important. Always think about the Five Ws Who, What, When, Where, Why (and How )when examining a set of data.
2. The Three Rules of Data Analysis The three rules of data analysis wont be difficult to remember: 1. Make a picture things may be revealed that are not obvious in the raw data. These will be things to think about. 2. Make a picture important features of and patterns in the data will show up. 3. Make a picture the best way to tell others about your data is with a well-chosen picture.
3. Qualitative Data :: Making Piles We can pile the data by counting the number of data values in each category of interest. We can organize these counts into a frequency table , which records the totals & category names. A relative frequency table is similar, but gives the percentages (instead of counts) for each category.
4. What Do Frequency Tables Tell Us? Frequency tables and relative frequency tables describe the distribution of a categorical variable because they name the possible categories and tell how frequently each occurs. Graphs Pie Charts & Bar Graphs (software)
5. A contingency table allows us to look at two qualitative variables together. Note the totals in the margins of the table. Each set of totals gives us the marginal distribution of the respective variable.
6. So What Do We Know? Qualitative variables can be summarized in frequency or relative frequency tables. Categorical variables can be displayed with bar graphs and/or pie charts. A contingency table summarizes two variables at a time. From a contingency table we can find the marginal distribution for each variable or the conditional distribution for one variable conditioned on the other variable.
7. Displaying Quantitative Data HISTOGRAMS First, slice up the entire span of values covered by the quantitative variable into equal-width piles called classes / bins. selection = art form The bins and the counts in each bin give the distribution of the quantitative variable. One graphical display of the distribution of a quantitative variable is called a histogram , which plots the bin counts as the heights of bars (like a bar graph). A relative frequency histogram displays the percentage of cases in each bin instead of the count.
8. Stem-and-leaf displays show the distribution of a quantitative variable, like histograms do, while preserving the individual values. Stem-and-leaf displays contain all the information found in a histogram.
9. First, cut each data value into leading digits (stems) and trailing digits (leaves). Use the stems to label the bins. Use only one digit for each leaf if necessary either round or truncate the data values.
10. A dotplot is a simple display. It just places a dot for each case in the data.
11. When describing a distribution, make sure to always tell about L.O.S.S. !!! Location/Center/Typical Value Outliers Spread/Dispersion Shape/Distribution
12. SHAPE 1. Symmetric 2. Skewed 3. Uniform or rectangular
13. Symmetric
14. Skewed Right-Tailed Left-Tailed
15. Uniform
16. So What Do We Know? Quantitative variables can be displayed using histograms , dotplots , and/or stem-and-leaf displays. These displays help us to see the distributions of the variables. Consider L.O.S.S. when looking at these displays! Distributions can be classified as symmetric or skewed (look at how the tails behave with respect to the rest of the distribution).