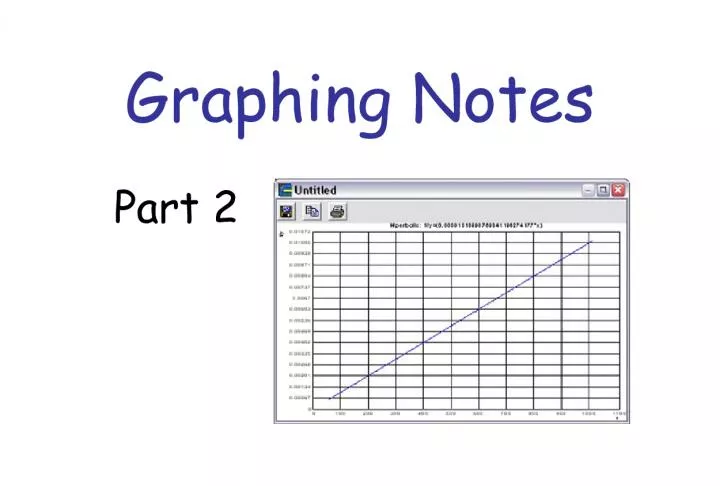
Graphing Notes Part 2: Patterns

When you graph data, you can identify what the pattern or trend of the data is. A linear graph is a graph with a straight line, which shows the relationship between the x axis
- Uploaded on | 1 Views
-
 jimmy
jimmy
About Graphing Notes Part 2: Patterns
PowerPoint presentation about 'Graphing Notes Part 2: Patterns'. This presentation describes the topic on When you graph data, you can identify what the pattern or trend of the data is. A linear graph is a graph with a straight line, which shows the relationship between the x axis. The key topics included in this slideshow are . Download this presentation absolutely free.
Presentation Transcript
Slide1Graphing NotesPart 2
Slide2Patterns• When you graph data, you can identify what the pattern or trend of the data is.
Slide3Linear Graph• A linear graph is a graph with a straight line. • This line shows the relationship between the x- axis and y-axis.
Slide4Nonlinear Graph• A nonlinear graph is any graph that does not use a straight line. • Sometimes the relationship between the x-axis and y-axis is shown with a curved line.
Slide5Direct Nonlinear• The line on a direct nonlinear curves upward.
Slide6Inverse Nonlinear• The line on an inverse nonlinear graph slopes downward.
Slide7Reproducibility of Data• Scientist want their results to be able to be reproduced or repeated . • If the data is not reproducible, then the results are NOT accepted as true .
Slide8Describing a Set of Data• MEAN: This is the average of the data collected of the dependent variable. • MEDIAN: This is the value of the data point in the middle. • MODE: This is the number that appears most often.
Slide9Slope of a Line• Slope is the degree of slant of a line.
Slide10Calculating the Slope• Rise = the vertical change • Run = the horizontal change. • Slope is calculated by dividing rise by run. 5/7 = .7
Slide11THE END