Understanding the Structure and Performance of Mutual Funds

This chapter provides an overview of mutual funds, including their structure, pricing, and types. It also covers how expenses and taxes impact fund returns, as well as how to assess fund performance.
- Uploaded on | 1 Views
-
 kynleekoch
About Understanding the Structure and Performance of Mutual Funds
PowerPoint presentation about 'Understanding the Structure and Performance of Mutual Funds'. This presentation describes the topic on This chapter provides an overview of mutual funds, including their structure, pricing, and types. It also covers how expenses and taxes impact fund returns, as well as how to assess fund performance.. The key topics included in this slideshow are investments, analysis, behavior, mutual funds, open-end funds, closed-end funds, exchange-traded funds, expenses, taxes, performance,. Download this presentation absolutely free.
Presentation Transcript
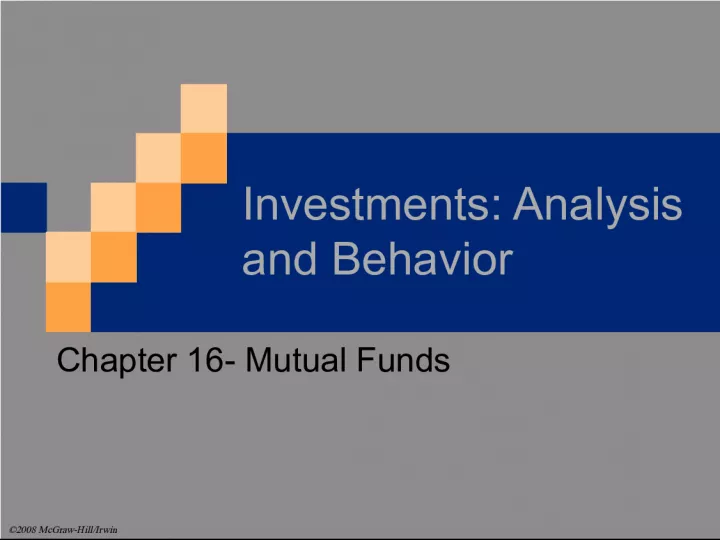
1. Investments: Analysis and Behavior Chapter 16- Mutual Funds 2008 McGraw-Hill/Irwin
2. 16-2 Learning Objectives Understand the structure and pricing of mutual funds Remember the differences between open-end, closed- end and exchange traded funds Recognize the impact of expenses and taxes on fund returns Assess mutual fund performance Know various types of mutual funds
3. 16-3 Mutual Funds An investment company that issues its portfolio shares to investors. Money from shareholders are pooled and invested in a wide range of stocks, bonds, or money market securities. Managed by professional managers Each investor shares proportionately in the income and investment gains and losses, as well as the brokerage expenses and management fees.
4. 16-4 1. Types of Mutual Funds Open-end Funds Closed-end Funds Exchange Traded Funds (ETF)
5. 16-5 Open-End Funds An open-end investment company is commonly called an open-end fund . A mutual fund has no limit on the size of the fund or the number of shares outstanding. Mutual fund shares are not sold to other investors. Instead, they are redeemed by the fund management. The value of a mutual fund share is called its net asset value .
6. 16-6 Open-End Investment Companies Insert Figure 21-1 here.
7. 16-7 Closed-End Funds A closed-end fund has a fixed number of shares. When the market price exceeds its NAV, selling at a premium, otherwise, selling at a discount Buy and sell like a stock. The pricing of closed-end fund shares is a financial puzzle - they usually sell at a discount to their net asset value (NAV) .
8. 16-8 Exchange Traded Funds (ETFs) Exchange traded fund (ETF) is a form of closed-end fund, embedded with some features of an open-end fund Traded like a stock at stock exchanges Share price is very close to its NAV Shares are redeemable!!
9. 16-9 2. Important mutual fund terms Net Asset Value (NAV) Fees Load: Expense ratio: 12b-1 fee: Alpha Beta
10. 16-10 Net asset Value NAV: per share value of a mutual funds investment holding. Example A mutual fund has $100 mil in assets and $3 mil in short term liabilities. 10.765 mil shares outstanding. What is the NAV? Solution ($100 mil - $3 mil) / 10.765 mil = $9.0107 per share
11. 16-11 Types of Mutual Funds Objective Funds Hold Growth Potential Income Potential Stability Money Market Funds Taxable money market Current income stability of principal Cash investments None Moderate Very high Tax-exempt money market Tax-free income, stability of principal Municipal cash investments None Moderate Very high Bond Funds Taxable bond Current income Wide range of government and/or corporate bonds None Moderate to high Low to moderate Tax-exempt bond Tax-free income Wide range of municipal bonds None Moderate to high Low to moderate Common Stock Funds Balanced Current income capital growth Stocks and bonds Moderate Moderate to high Low to moderate Equity income High-yielding stocks, convertible bonds Moderate to high Moderate Low to moderate Value funds Low P/E, P/B stocks Moderate to high Low to moderate Low to moderate Growth and income Dividend-paying stocks Moderate to high Low to moderate Low to moderate Domestic growth Capital growth U.S. stocks with high potential for growth High Very low Low International growth Stocks of companies outside U.S. High Very low to low Very low Aggressive growth Aggressive growth of capital Stocks with very high potential for growth Very high Very low Very low Small cap Stocks of small companies Very high Very low Very low Specialized Stocks of industry sectors High to very high Very low to moderate Very low to low
12. 16-12 1 ) Load and No-Load Load funds is a sales charge . If paid at the time of purchase, the fee is a front-end load . If levied when shares are sold, the fee is a back-end load , or contingent deferred sales charge . A no-load fund charges no sales commission. Fees Most mutual funds separate their charges into a number of categories.
13. 16-13 The Investment Company Industry : Fees Insert Figure 21-2 here.
14. 16-14 Expense Ratio Annual fee charges are calculated by a funds expense ratio , which is the funds total expenses expressed as a percentage of the funds assets. (range from 0.2% to 2%) management fee : includes salaries and bonus paid to fund managers 12-b fees : advertising costs on to the accountholders Other fees
15. 16-15 Expense Ratio A mutual fund could have several classes of shares with different fee combinations. Studies indicate that Expense ratio is normally lowest for money market mutual funds and highest for international stock funds Tend to be lowest for large, liquid funds The lower the expense ratio, the better the fund performance.
16. 16-16 The Investment Company Industry : Fees Insert Figure 21-3 here.
17. 16-17 Fund A Fund B Fund C Shareholder Transaction Expenses Sales load imposed on purchases None None 4.75% Sales load imposed on reinvested dividends None None 4.75 Redemption fees None None None Exchange fees None None None Annual Fund Operating Expenses Management and administrative expenses 0.22% 0.60% 0.70% Investment advisory expenses 0.02 12b-1 marketing fees 0.30 Marketing and distribution costs 0.02 Miscellaneous expenses 0.03 0.32 0.26 Total Operating Expenses 0.29% 1.22% 0.96% Expenses on a $10,000 Investment 1 year $ 30 $ 124 $ 587 3 years 93 387 823 5 years 163 670 1,077 10 years 368 1,477 1,805 Table 16.4 A. Typical fee tables found in three different mutual fund prospectuses
18. 16-18 B. The impact of equity mutual fund costs on long-term investor returns. Fund A Fund B Fund C Initial investment $ 10,000 $10,000 $10,000 Day 1 10,000 10,000 9,525 5 years 18,189 17,451 16,186 10 years 33,084 30,565 29,689 15 years 60,178 53,145 52,416 20 years 109,458 92,743 92,539 Gross return 13.00% 13.00% 13.00% Operating expenses 0.29% 1.22% 0.96% Net return 12.71% 11.78% 12.04% Fund A : typical cost efficient index fund Fund B : conventional no-load stock mutual fund Fund C : low-load stock mutual fund with less than typical annual operating expenses
19. 16-19
20. 16-20 Sources of Investment Returns Total Return: dividend and interest income and realized and unrealized appreciation Income distribution: interest and dividend income after expenses. Capital gains unrealized until the fund sells the shares (Unrealized capital gains) The realized capital gains are paid out to shareholders at the end of the year (capital gains distributions)
21. 16-21 Taxes Shareholders pay taxes due once income dividends and capital gains distributions are received. All income and capital gains distributions are generally subject to income taxes. Municipal bond or US T-securities interest income exempt from federal taxes, but capital gains are taxable. Turnover rate: expressed as a percentage of the funds average assets (average turnover rate for stock mutual fund: 79%)
22. 16-22 Selecting A Mutual Fund before-load (gross) return change in net asset value capital gains distributions income distributions beginning net asset value + + = after-load (net) return change in net asset value capital gains distributions income distributions beginning net asset value + + - = load fee With a mutual fund, return comes from the change in net asset value , capital gains distributions , and income distributions .
23. 16-23
24. 16-24 3. Fund Performance Using ranking tools or portfolio evaluation tools (alpha , Sharp ratio, and Treynor measure)
25. 16-25 Style boxes Value Strategy (Score <1.75) Blend (1.75 Score 2.25) Growth Strategy (Score > 2.25) Large-cap (Top 5%) S & P 500 Benchmark Mid-cap (Next 15%) Wilshire 4500 Benchmark Small-cap (Bottom 80%) Russell 2000 Benchmark Characterize mutual funds by market capitalization (large, mid, and small cap) Next, determine how cheap or expensive portfolio holdings are relative to the overall market using P/E and P/B ratios (Value, Blend and Growth)
26. 16-26 4. Selecting A Mutual Fund : Types of Funds Insert Figure 21-4 here.
27. 16-27 Money market funds invest in short-term government securities and sometimes in short- term corporate securities. They are used primarily as a temporary cash haven. Bond funds invest in fixed income securities. They vary widely, and have no common maturity date to simultaneously return the components to their par value. Stock funds vary widely in their risk and price behavior. They are classified as growth or value, and as large-cap or small-cap.
28. 16-28 A balanced fund is a mixture of stocks and fixed income securities. It forces discipline on the fund manager. An international fund is limited to buying securities registered outside the country where it is sold, while a global fund can invest anywhere in the world. A fund of funds invests only in other mutual funds. Its diversification is good, but its expense ratio tends to be higher than that of the typical mutual fund.
29. 16-29 Sector : Such funds invest in specific market sectors, such as physical commodities or stocks closely tied to natural resources e.g. oil, forest products, and gold. An index fund may be a stock or bond fund that tries to behave exactly like the market. A stock index fund, for instance, may seek to mirror the performance of the Standard & Poors 500 stock index. Investors should determine their investment objective first, and then choose an appropriate fund or group of funds .
30. 16-30 Insert Table 21-2 here.
31. 16-31 Information Sources : Company Information The prospectus is a legal document describing the operation of the fund, its management, and the fees accountholders must pay. One important item in the prospectus is the funds portfolio turnover rate . A higher rate usually means higher expenses. The Statement of Additional Information is required by the SEC, although it is generally only sent to accountholders upon their request. It is a more detailed version of the prospectus.
32. 16-32 Review Concepts Open-end fund, closed-end fund, ETF load charge, NAV, 12-b fees, expense ratio, alpha
33. 16-33 Sources of Information Lipper Inc.: leading provider of data and analysis on the investment company business ( www.lipperweb.com ) Morningstar.com: provide unbiased data and analysis and candid editorial commentary ( www.morningstar.com ) Vanguard Group: providing competitive investment performance and lowest operating expenses ( www.vanguard.com )