Fire Management Strategies in the Face of Climate Change

This presentation addresses the impact of climate change on fire danger and management strategies, with a focus on the King Island region. We explore past and projected climate change factors, adaptation measures, and the McArthur Fire Danger rating system.
- Uploaded on | 0 Views
-
 lainey96
About Fire Management Strategies in the Face of Climate Change
PowerPoint presentation about 'Fire Management Strategies in the Face of Climate Change'. This presentation describes the topic on This presentation addresses the impact of climate change on fire danger and management strategies, with a focus on the King Island region. We explore past and projected climate change factors, adaptation measures, and the McArthur Fire Danger rating system.. The key topics included in this slideshow are Fire management, climate change, King Island, adaptation, McArthur Fire Danger rating,. Download this presentation absolutely free.
Presentation Transcript
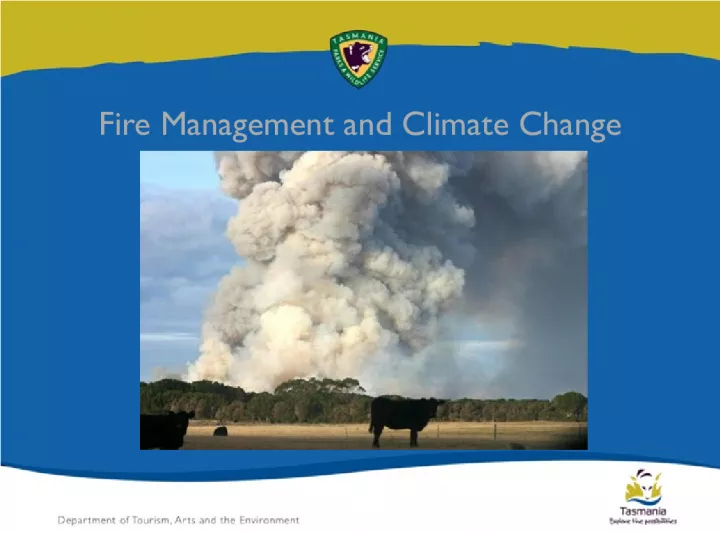
1. Fire Management and Climate Change
2. Fire climate factors Past climate change Projected climate change King Island Fire Management adaptation Slide title sits here Introduction
3. A number between 0 and 100 that is directly related to the chances of a fire starting, its rate of spread, intensity and difficulty of suppression according to various combinations of temperature, relative humidity, wind speed and both long and short term drought effects. A.G. McArthur 1973 Fire Danger
4. Fire Danger: Rainfall prolonged summer drought Humidity dry air Wind Lightning ignitions Fire Climate Factors
5. More & bigger fires, longer fire seasons More fire sensitive vegetation burnt Shorter inter-fire intervals secondary effects, eg poor recruitment Increased organic soil loss Increase in fire suppression & mitigation Fire and Climate Change Impacts
6. Rainfall Fire Danger Ratings Lightning ignitions Trends in Past Climate Change
7. 1946 1980 2006 % Difference from mean King Island Annual Rainfall
8. Launceston Forest Fire Danger Index
9. Launceston Forest Fire Danger Index
10. Spring FFDI > 40 at Hobart
11. In Tasmania there is no strong relationship between thunderstorms and fire. .....0.01% of the total area burnt in a 12 year period. Bowman and Brown 1986 Lightning in Tasmania
12. Lightning Fires - PWS Records
13. Wildfire Ignitions - PWS Records Summary Total Area % Number % Lightning 46 9 Arson 15 42 Undetermined 11 22 Other 28 28 100 100 Fire seasons 1991/92 to 2006/07
14. Projected Climate Change
15. Lucas et al. 2007: CSIRO climate simulations projections for 2020 & 2050 compared to present (1973-2007) annual cumulative FFDI days with FFDI >24 Projected Climate Change
16. Lucas et al. 2007: Little change in FFDI expected for Launceston or Hobart. Significant changes on mainland Projected Climate Change
17. Projected Climate Change Site Now 2020 2050 Canberra 16.8 18.3 22.8 20.0 33.4 Hobart 2.0 2.0 2.1 2.0 2.2 Launceston AP 1.0 1.0 1.2 1.0 2.2 Average no. days per year FFDI > 24:
18. Simulation of Fire Risk
19. Projection Problems Understanding fire climatology what weather factors correlate with fires? Lack of climate modelling for: Lightning Drought Regional areas
20. King Island Fires
21. King Island Fires 2001 fire 2007 fire
22. King Island Fire
23. King Island Fire
24. King Island Fires Organic soil loss: Estimated 1,700 hectares peat in Lavinia 200 hectares peat lost per fire (2001 & 2007) 9 fires 1 fire per century no peat in 900 years
25. King Island Fires Factors causing increased peat loss: Lower rainfall for 27 years Land use change surrounding swamp draining & land clearance Increased ignition sources people lightning
26. King Island Fire 2007
27. King Island Fire 2007
28. Management Adaptation Heads Up: Longer operational fire seasons More prescribed burning Sacrificial zones More $$
29. King Island Fire 2007
30. Cracroft Fire 2007