Introduction to Descriptive and Inferential Statistics
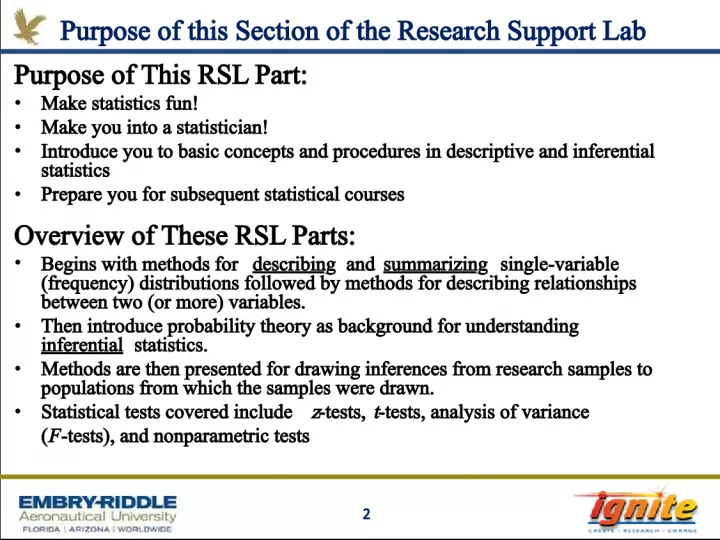

This section of the Research Support Lab will make statistics fun by introducing you to basic concepts and procedures in descriptive and inferential statistics, preparing you for subsequent courses, and covering statistical tests such as z-tests, t-tests, ANOVA, F-tests, and nonparametric tests. We'll start with methods for describing and summarizing single variable frequency distributions, before moving on to methods for describing relationships between variables and probability theory.
- Uploaded on | 0 Views
-
 langworth
About Introduction to Descriptive and Inferential Statistics
PowerPoint presentation about 'Introduction to Descriptive and Inferential Statistics'. This presentation describes the topic on This section of the Research Support Lab will make statistics fun by introducing you to basic concepts and procedures in descriptive and inferential statistics, preparing you for subsequent courses, and covering statistical tests such as z-tests, t-tests, ANOVA, F-tests, and nonparametric tests. We'll start with methods for describing and summarizing single variable frequency distributions, before moving on to methods for describing relationships between variables and probability theory.. The key topics included in this slideshow are statistics, descriptive statistics, inferential statistics, probability, z-test, t-test, ANOVA, F-test, nonparametric test,. Download this presentation absolutely free.
Presentation Transcript
2. 2 Purpose of This RSL Part: Make statistics fun! Make you into a statistician! Introduce you to basic concepts and procedures in descriptive and inferential statistics Prepare you for subsequent statistical courses Overview of These RSL Parts: Begins with methods for describing and summarizing single-variable (frequency) distributions followed by methods for describing relationships between two (or more) variables. Then introduce probability theory as background for understanding inferential statistics. Methods are then presented for drawing inferences from research samples to populations from which the samples were drawn. Statistical tests covered include z -tests, t -tests, analysis of variance ( F -tests), and nonparametric tests Purpose of this Section of the Research Support Lab
3. 3 Textbook Shavelson, R.J. (1996). Statistical reasoning for the behavioral sciences (3 rd Ed.). Boston: Allyn & Bacon. Supplemental Material Ruiz-Primo, M.A., Mitchell, M., & Shavelson, R.J. (1996). Student guide for Shavelson statistical reasoning for the behavioral sciences (3 rd Ed.). Boston: Allyn & Bacon. Textbook Credits
4. 4 Excel MegaStat Minitab SPSS JMP POM/QM StatCrunch Statistical Software
5. 5 Research Defined Research is doing ones damnedest to answer perplexing questions Or research is a systematic approach to finding answers to questions Scientific research, our focus, seeks answers to questions empirically and by inference, ruling out counter-interpretations to the one justified by the data With the scientific method, problems are formulated, hypotheses are identified, data are collected, inferences are drawn about which hypothesis is more credible The purpose of empirical research, therefore, is to provide answers to questions about behavior using the scientific method
6. 6 Statistics Defined Statistics is the science of conducting studies to collect, organize, summarize, analyze, and draw conclusions from data. Descriptive statistics consists of: the collection Organization Summarization presentation of data Inferential statistics consists of: generalizing from samples to populations performing estimations hypothesis testing determining relationships among variables making predictions
7. 7 Research Questions/Steps in Conducting Research Research Questions What is happening? Is there a systematic (causal) effect? Why or how is it happening (mechanism)? Steps in Conducting Research 1. Identify and define a research problem 2. Formulate hypothesis based on theory, research, or both 3. Design the research 4. Conduct the research 5. Analyze the data 6. Interpret the data as they bear on the research question
8. 8 Data Collection and Sampling Techniques Surveys are the most common method of collecting data. Three methods of surveying are: Telephone surveys Mailed questionnaire surveys Personal interviews Other methods include historical data gathering (empirical data)
9. 9 Some Terminology Variable : is a characteristic or attribute that can assume different values(height, ability) Data are the values that variables can assume. Random variables have values that are determined by chance. A population consists of all subjects that are being studied. A sample is a group of subjects selected from a population. Random samples are selected using chance methods or random methods. Independent Variable(Factor/Treatment) : A variable that is measured , manipulated (type of instruction), or selected (e.g., sex) to determine its relationship to some other observed variable. Control Variable : A variable which is held constant (or is controlled) to neutralize its effect on the dependent variable because it is not the focus of the study (e.g., control on sex in a reading study) Intervening Variable : A conceptual or theoretical variable that accounts for the relation between independent and dependent variable; an explanation for the relation or a hypothesized mechanism that accounts for the relation. Dependent Variable(Response) : A variable that is observed and measured to determine its response to the independent variable (i.e., dependent on the independent variable)
10. 10 Measurement Scales Nominal classifies data into mutually exclusive (non- overlapping), exhausting categories in which no order or ranking can be imposed on the data. Ordinal classifies data into categories that can be ranked; however, precise differences between the ranks do not exist. Interval ranks data, and precise differences between units of measure do exist; however, there is no meaningful zero. Ratio possesses all the characteristics of interval measurement, and there exists a true zero.
11. 11 Measurement Scales: Classification of Data
12. 12 Some Terminology: Summation Notation Summation notation is mathematical notation commonly used in statistics Its really simple if you pause, take a deep breath, relax and enjoy it a little patience goes a long ways
14. 14 Research Designs Pre-experimental Designs One-shot Case Study (Treatment group only) One Group Pretest to Posttest Design measures of change Intact Group Comparison at posttest Experimental Designs Random assignment to treatment & control group Posttest Only Control Group Pretest-Posttest Control Group Factorial Quasi-experimental Designs Non-random assignment to treatment & control group observed Nonequivalent-Control Group Design Time-Series Design Ex-Post Facto Designs Statistical controls for comparing alternative treatments Correlational Design Criterion-Group Design
15. 15 Pre-experimental Designs One-shot Case Study (Treatment group only) Example: X is a new personnel policy, a job satisfaction measurement is taken, and then a response is observed One Group Pretest to Posttest Design measures change Example: A job satisfaction measurement is taken before and after treatment X is applied Intact Group Comparison at posttest Example: G 1 receives the treatment, G 2 does not; then a job satisfaction measurement is taken and observed (in this case G 1 and G 2 may represent two different business units) X Control O O G 1 G 2 O X X O 2 O 1
16. 16 Experimental Designs Random assignment to treatment & control group Posttest Only Control Group Pretest-Posttest Control Group Factorial X Control O 2 O 2 O 1 O 1 X Control O O Example: A job satisfaction measurement is taken after treatment X 1 is applied or not and graveyard shift X 2 is implemented X 2 X 1 O O X 2 Control
17. 17 Quasi-experimental Designs Non-random assignment to treatment & control group observed. Include one or more control groups. Nonequivalent-Control Group Design Subjects receive a pretest (O 1 ) treatment or non-treatment and then receive a posttest (O 2 ) Time-Series Design Multiple observations are taken before and after a treatment is administered. Pretreatment observations establish a control group baseline. Post-treatment observations establish a consistent change in response. X Control O 2 O 2 G 1 G 2 O 1 O 1 X O 2 O 1
18. 18 Ex-Post Facto Designs Statistical controls for comparing treatment and control (relationships between two variables). Called ex-facto because the researcher arrives after the treatment has been administered. Correlational Design SAT scores (O 1 ) and GPA (O 2 ) are collected. Criterion-Group Design Group 2 is compared to Group 1 O 1 O 2 O O G 1 G 2
19. 19 Threats to Internal Validity History: - something co-occurring with the treatment caused the outcome Maturation - maturation, not the treatment, caused the outcome Mortality - loss of poorly performing subjects from a group caused the outcome Statistical Regression - extreme groups are likely to improve on retesting Selection bias - the differences in outcomes existed before the treatments were given Instrumentation - outcome measure not reliable, valid, or both Testing - pretest cued subjects to outcome measure Stability - Type I Error
20. 20 History Threat Occurrence of events other than the independent variable. Treatment (X) Control
21. 21 Maturity Threat Treatment (X) There may be developmental (physical or mental) changes occurring to the subjects during the time of the experiment
22. 22 Mortality Threat Treatment (X) Some subjects drop out the study and they have something in common, say, low achievement.
23. 23 Regression Threat Treatment (X) The groups were selected on the basis of extreme score. (Regression effect: low-extreme tends to increase, high- extreme tends to drop)
24. 24 Selection Threat Initial difference exist in groups Treatment (X) Control
25. 25 Instrumentation Threat Treatment (X) The measuring instruments is not reliable or not valid, therefore, the score obtained by subjects could not be accurate. ? ?
26. 26 Testing Threat Treatment (X) The subject learns from the pretest, therefore, scores better on the posttest Pretest
27. 27 Testing Threat Type I Error producers risk ( ) Type II Error consumers risk ( ) Correct Decision Correct Decision Do not reject H 0 Reject H 0 H 0 True H 0 False A type I error occurs if one rejects the null hypothesis when it is true. A type II error occurs if one does not reject the null hypothesis when it is false.
28. 28 Ideal Model Experimental Design (Control Group + Random Assignment) Treatment (X) Control Randomly Assigned
29. 29 Practice Exercises 1. Select two out of the four major Research Designs. 2. Support your two selected research designs with original hypothetical examples as outlined in this presentation. 3. Compare and contrast them with one another. 4. Indicate all threads to validity that you can document.