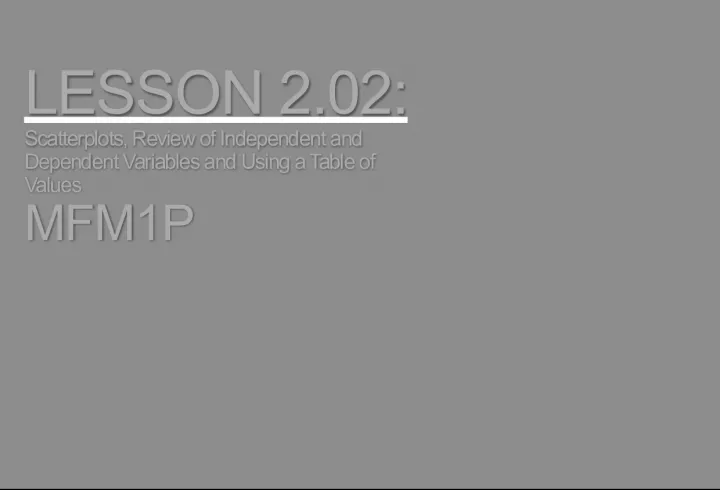
Lesson 2.02 Scatterplots: Review of Independent and Dependent Variables and Using a Table of Values

In this lesson, we will review the concepts of independent and dependent variables and how they are used in data analysis. We
- Uploaded on | 2 Views
-
 lenni
lenni
About Lesson 2.02 Scatterplots: Review of Independent and Dependent Variables and Using a Table of Values
PowerPoint presentation about 'Lesson 2.02 Scatterplots: Review of Independent and Dependent Variables and Using a Table of Values'. This presentation describes the topic on In this lesson, we will review the concepts of independent and dependent variables and how they are used in data analysis. We. The key topics included in this slideshow are . Download this presentation absolutely free.
Presentation Transcript
Slide1LESSON 2.02: Scatterplots, Review of Independent and Dependent Variables and Using a Table of Values MFM1P LESSON 2.02: Scatterplots, Review of Independent and Dependent Variables and Using a Table of Values MFM1P
Slide21.Welcome back! 1. Welcome back! 2. Data Analysis Assignments 2. Data Analysis Assignments 3. Looking ahead! 3. Looking ahead!
Slide3The value of the dependent variable , as its name implies, is determined by the value of the independent variable.
Slide5Age and fitness levels Age and fitness levels Amount of sleep the night before a test and mark on the test Amount of sleep the night before a test and mark on the test Calories eaten per day and weight Calories eaten per day and weight Height of grade 9 girls (cm) and the height of their mothers (cm) Height of grade 9 girls (cm) and the height of their mothers (cm) Money raised and number of cars washed Money raised and number of cars washed
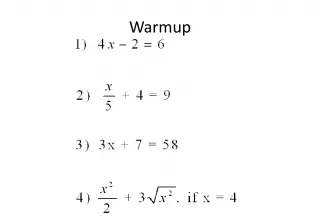
Slide7relationships between 2 variables can be represented byan equation, a table of values , and a graph . Example: Complete a table of values for y = -3x+10 Solution: Solution: To calculate each corresponding y value, substitute the given value of x. To calculate each corresponding y value, substitute the given value of x. For x=1 For x=1 y = -3(1)+10 y = -3(1)+10 y = -3+10 y = -3+10 y = 7 Therefore, the first point is (1, 7) y = 7 Therefore, the first point is (1, 7) For x=2 For x=2 y= -3(2)+10 y= -3(2)+10 y = -6+10 y = -6+10 y = 4 Therefore, the next point is (2, 4) y = 4 Therefore, the next point is (2, 4) Continue for x=3, 4, and 5 Continue for x=3, 4, and 5 Independent Dependent
Slide8Jody works at a factory that produces squaretiles for bathrooms and kitchens. She helps determine shipping costs by calculating the perimeter of each tile. The perimeter is determined by adding the lengths of the 4 sides of each tile.
Slide9a)a) Calculate the perimeter and record your observations in a table of values. b) Describe what happens to the perimeter of each tile when the side length increases by one centimetre. c) Construct a graph of the perimeter of a tile vs. the side length of the tile. Length of side (cm) Perimeter (cm) 1 2 3 4 5
Slide10Length ofside (cm) Perimeter (cm) 1 2 3 4 5 REMEMBER TAILS! REMEMBER TAILS! REMEMBER TAILS! REMEMBER TAILS! T – Title T – Title A – Axis I – Interval L – Labels S – Scale
Slide11d) which variable is the independent variable (side length orperimeter)? e) Which variable is the dependent variable(side length or perimeter)? f) Use the graph to describe the relationship between the perimeter and side length of a tile. g) Describe the shape of the graph.
Slide12Jody’s is paid $8/hour tocalculate perimeters. Calculate her pay and record your observations in a table of values .
Slide13Hours of workPay ($) 1 2 3 4 5
Slide14Hours ofwork Pay ($) 1 2 3 4 5 REMEMBER TAILS! REMEMBER TAILS! REMEMBER TAILS! REMEMBER TAILS!
Slide15a) describe what happens to her pay when the number ofhours she works increases by one hour. b) Construct a graph of her pay vs. the number of hours she works. c) Which variable is the independent variable? d) Which variable is the dependent variable? e) Use the graph to describe the relationship between her pay and the number of hours she works. f) Describe the shape of the graph.