LP Solution Methods: Graphical, Corner Point, and Excel Solver

This article by Anita Lee Post from 2003 explains three LP solution methods: graphical, corner point, and Excel Solver. The graphical method is limited to problems with two decision variables and involves plotting constraint equations and determining the area of feasibility to find the optimum point.
- Uploaded on | 4 Views
-
 nadiablick
About LP Solution Methods: Graphical, Corner Point, and Excel Solver
PowerPoint presentation about 'LP Solution Methods: Graphical, Corner Point, and Excel Solver'. This presentation describes the topic on This article by Anita Lee Post from 2003 explains three LP solution methods: graphical, corner point, and Excel Solver. The graphical method is limited to problems with two decision variables and involves plotting constraint equations and determining the area of feasibility to find the optimum point.. The key topics included in this slideshow are LP solution methods, graphical method, corner point solution method, Excel Solver solution method, decision variables,. Download this presentation absolutely free.
Presentation Transcript
1. 2003 Anita Lee-Post Linear Programming Part 2 By Anita Lee-Post
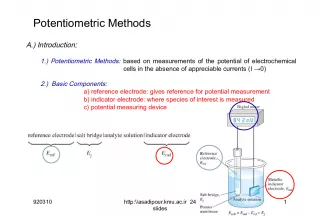
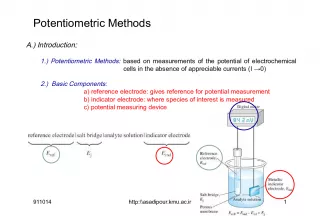
2. 2003 Anita Lee-Post LP solution methods Graphical solution method Corner-point solution method Excel Solver solution method
3. 2003 Anita Lee-Post Graphical solution method Limited to 2 decision variables problems 1. Assign X 1 and X 2 to the vertical and horizontal axes 2. Plot constraint equations 3. Determine the area of feasibility 4. Plot the objective function 5. Find the optimum point
4. 2003 Anita Lee-Post LP example #1 Minimize Cost = 5X 1 + 3X 2 Subject to: 100X 1 + 100X 2 >= 4000 200X 1 + 400X 2 >= 10000 200X 1 + 100X 2 >= 5000 X 1 , X 2 >= 0
5. 2003 Anita Lee-Post Graphical solution method Step 1. Assign decision variables to axes X1 X2
6. 2003 Anita Lee-Post Graphical solution method continued Step 2. Plot constraint 100X 1 +100X 2 >= 4000 1. Plot the line 100X 1 + 100X 2 = 4000 ( 0 , 40 ), ( 40 , 0 ) 2. Determine the constraint region ( 0 , 0 ) < 4000, thus, the constraint region is to the right of the line X1 X2 40 40 ( 0 , 0 )
7. 2003 Anita Lee-Post Graphical solution method continued Step 2. Plot constraint 200X 1 +400X 2 >= 10000 1. Plot the line 200X 1 + 400X 2 = 10000 ( 0 , 25 ), ( 50 , 0 ) 2. Determine the constraint region ( 0 , 0 ) < 10000, thus, the constraint region is to the right of the line X1 X2 40 50 ( 0 , 0 ) 40 25
8. 2003 Anita Lee-Post Graphical solution method continued Step 2. Plot constraint 200X 1 +100X 2 >= 5000 1. Plot the line 200X 1 + 100X 2 = 5000 ( 0 , 50 ), ( 25 , 0 ) 2. Determine the constraint region ( 0 , 0 ) < 5000, thus, the constraint region is to the right of the line X1 X2 40 50 ( 0 , 0 ) 40 25 25 50
9. 2003 Anita Lee-Post Graphical solution method continued Step 3. Determine the area of feasibility The area of feasibility is found by intersecting the three constraint regions X1 X2 40 50 ( 0 , 0 ) 40 25 25 50 Area of feasibility
10. 2003 Anita Lee-Post Graphical solution method continued Step 4. Plot the objective function: cost = 5X 1 + 3X 2 1. Assume an arbitrary cost, e.g., 150 2. Plot the line 5 X 1 + 3 X 2 = 150 ( 0 , 50 ), ( 30 , 0 ) X1 X2 ( 0 , 0 ) 50 Area of feasibility 30 Cost = 150
11. 2003 Anita Lee-Post Graphical solution method continued Step 5. Find the optimal point 1. The region to the left of the iso-cost line (Cost=150) is represented by Cost <= 150 Move the iso-cost line leftwards until it reaches the most extreme point of the area of feasibility. 2. The extreme point is the optimal point ( 10 , 30 ) X1 X2 ( 10 , 30 ) 50 Area of feasibility 30 Cost = 150
12. 2003 Anita Lee-Post LP example #2 Maximize Profit = 40X 1 + 30X 2 Subject to: X 1 <= 400 X 2 <= 700 X 1 + X 2 <= 800 X 1 + 2X 2 <= 1000 X 1 , X 2 >= 0
13. 2003 Anita Lee-Post Graphical solution method Following the 5-step process, the optimal point is found to be X 1 =400, X 2 =300 X1 X2 ( 400 , 300 ) 700 Area of feasibility 400 Profit = 12000 X1=400 X2=700 800 800 X1+X2=800 1000 500 400 300 X1+2X2=1000
14. 2003 Anita Lee-Post Corner-point solution method Use in conjunction with the graphical solution method to pinpoint the optimal point algebraically 1. Find the co-ordinates of each corner point of the feasible region by simultaneously solving the equations of a pair of intersecting lines 2. Substitute the values of the co-ordinates in the objective function
15. 2003 Anita Lee-Post LP example #1 X1 X2 A B C D Corner Point Intersecting lines Coordinates Cost=5X1 + 3X2 A X2=0 200X1 + 400X2=10000 X1=50, X2=0 Cost=250 B 100X1 + 100X2 = 4000 200X1 + 400X2=10000 X1=30, X2=10 Cost=180 C 100X1 + 100X2 = 4000 200X1 + 100X2 = 5000 X1=10, X2=30 Cost=140* D X1=0 200X1 + 100X2 = 5000 X1=0, X2=50 Cost=150 Optimal solution
16. 2003 Anita Lee-Post LP example #2 X1 X2 X1=400 Corner Point Intersecting lines Coordinates Profit=40X1 + 30X2 A X2=0 X1=400 X1=400, X2=0 Profit=16000 B X1=400 X1 + 2X2 = 1000 X1=400, X2=300 Profit=25000 C X1=0 X1 + 2X2 = 1000 X1=0, X2=500 Profit=15000 D X1=0 X2=0 X1=0, X2=0 Profit=0 A B C D X1 + 2X2 = 1000 Optimal solution