Oceanography Unit at Twin Falls Middle School

Mrs. Katrina D. W. Alegado, an 8th grade science teacher and ASB advisor, taught the Oceanography Unit to 132 students at Twin Falls Middle School in the Snoqualmie Valley School District. The unit aimed at deepening students' understanding of topics including El Nino, La Nina, ocean acidification, Atlantic and Pacific Coasts, temperature and currents, and microbes. Students of all levels utilized websites, analyzed near-real-time data, engaged in discussions, and synthesized their learning through a visual quiz. 11 students receiving free and reduced lunch and 22 students with IEPs were included.
- Uploaded on | 3 Views
-
 priscilla25
About Oceanography Unit at Twin Falls Middle School
PowerPoint presentation about 'Oceanography Unit at Twin Falls Middle School'. This presentation describes the topic on Mrs. Katrina D. W. Alegado, an 8th grade science teacher and ASB advisor, taught the Oceanography Unit to 132 students at Twin Falls Middle School in the Snoqualmie Valley School District. The unit aimed at deepening students' understanding of topics including El Nino, La Nina, ocean acidification, Atlantic and Pacific Coasts, temperature and currents, and microbes. Students of all levels utilized websites, analyzed near-real-time data, engaged in discussions, and synthesized their learning through a visual quiz. 11 students receiving free and reduced lunch and 22 students with IEPs were included.. The key topics included in this slideshow are . Download this presentation absolutely free.
Presentation Transcript
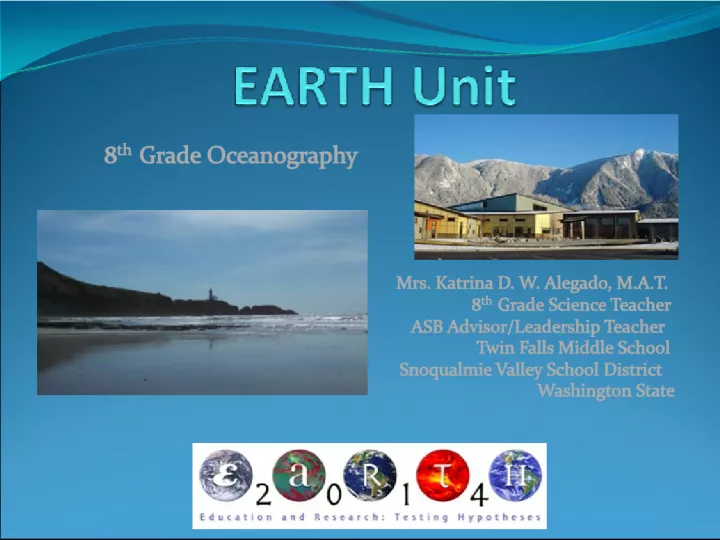
1. Mrs. Katrina D. W. Alegado, M.A.T. 8 th Grade Science Teacher ASB Advisor/Leadership Teacher Twin Falls Middle School Snoqualmie Valley School District Washington State 8 th Grade Oceanography
2. Oceanography Unit Details Taught to four 8 th grade science classes. 132 students total. 11% Free and reduced lunch. 22 IEP students. Students of all different levels.
3. Unit Objectives Gain a deeper understanding of basic oceanography topics : El Nino/La Nina, ocean acidification, Atlantic & Pacific Coasts (temperature and currents), and microbes. Navigate through websites to apply information and answer questions. Utilize near-real time data to make conclusions by analyzing data. Engage in class discussions. Synthesize learning by completing a visual quiz.
4. Next Generation Science Standards Patterns in rates of change and other numerical relationships can provide information about natural and human designed systems. Patterns can be used to identify cause and effect relationships. Graphs, charts, and images can be used to identify patterns in data. Science investigations use a variety of methods and tools to make measurements and observations. Advances in technology influence the progress of science and science has influenced advances in technology. All human activity draws on natural resources and has both short and long term consequences, positive as well as negative, for the health of people and the natural environment.
5. Unit Analysis/Rubric Strengths Weaknesses Technology integration Not in curriculum Student engagement Reading level on some websites Current events Not enough time! Higher level questioning Data interpretation struggles
6. Unit Modifications/Adjustments Creation of introduction presentations to provide background information for each topic. Formative assessments (through questioning techniques & webquests). Clear expectations for the research portion (see student sheets). Comprehension help for my lower level readers. Visual quiz to help students synthesize their learning.
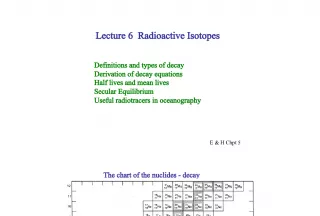
7. Graph Analysis-Lesson #1 A brief introduction to El Nino/La Nina and data analysis preceded this lesson. Students analyzed near-real time data from HOT- DOGS (Hawaii Ocean Time-series Data Organization & Graphical System). Focusing on 1997 and 1999, students recorded temperature, salinity, and oxygen data from these two years. Working in groups, students analyzed the data/graphs and determined which year was El Nino or La Nina.
8.
9. Atlantic and Pacific Coasts-Lesson #2 Students completed a webquest to introduce NANOOS (Northwest Association of Networked Ocean Observing Systems) and SECOORA (Southeast Coastal Ocean Observing Regional Association). Then, they gathered near-real time data from buoys/platforms in NANOOS and SECOORA. This data was then graphed and analyzed to demonstrate water temperature differences (currents) caused by uneven heating of the Earth.
10. Ocean Acidification-Lesson #3 An introductory presentation provided background information about Ocean Acidification. Students conducted a webquest to learn more about ocean acidification from various websites and resources. To demonstrate their understanding, with a call to action about this issue, students finished a poster project as a formative assessment.
11. Poster Project
14. Microbes-Lesson #4 With a presentation from C-DEBI , I introduced microbes. http://www.darkenergybiosphere.org/resources/toolbox.html Using some Internet resources, students researched a microbe and made a card with a picture and facts about microbes. Students were fascinated and very interested in microbes.
15.
16. Final Assessment After studying four basic parts to oceanography through EARTH lessons, I created a final Oceanography visual quiz. Students used their notebooks to demonstrate understanding of the four concepts by explaining in words and diagrams. They finished with a paragraph summary.
17. Final Assessment
18.
19.
20.
21.
22. Paragraph Summary Example “In this unit, I now understand a lot more about our oceans. By doing a webquest on the websites NANOOS/SECOORA, I learned a lot about temperature, salinity, El Nino, and La Nina, and also about dissolved oxygen. By doing real-time data from Mrs. Alegado, it helped me understand more about the topic. For example, when Mrs. Alegado gave us real-rime data for El Nino and La Nina, it helped me understand more about why it happened. By doing that I also learned about the upwelling it brought. I also learned a lot about microbes, which I think is cool. It’s really weird to think that there are more microbes on your hand then there are people in the world! Learning about out Earth’s oceans is better and more fun than I thought.” -Lexie, 8 th Grade Student, TFMS
23. Paragraph Summary Example “The ocean is a very unexplored area in science. Programs such as NANOOS/SECOORA go out and study the oceans. They collect data such as temperature, salinity levels, carbonate levels, dissolved oxygen, etc. They put this data on their websites so that we can look at real-time data. It is interesting to see what kinds of things are happening to the oceans and how this affects us. Scientists also study the oceans for problems they hope to solve. An example of a huge problem is ocean acidification. This is where carbon dioxide levels from the air gets absorbed by the ocean, this creates acid and less carbonate. Even with all of the data scientists have collected there is still so much ocean and creatures yet to be discovered.” -Kyle, 8 th Grade Student, TFMS
24. Inspiration! Not only did my students enjoy learning about Oceanography, but many of my students took it even further. For the second year in a row, one of my students was accepted into the Summer Marine Lab Experience for High School Students at the USC Wrigley Marine Science Center in Catalina Island, CA! Congratulations Journey!
25. Resources If you would like any lesson resources from my presentation today, just let me know! Thank you!!!