Analysis of Nanostructural Layers using Low Frequency Impedance Spectroscopy: A Case Study on Self-Assembled Alkane Layers on Silicon

This paper presents a detailed analysis of self-assembled alkane layers on silicon using low frequency impedance spectroscopy. The actual impedance data for a tetradecane film on silicon wafer electrolyte is examined and a 2 layer circuit model is proposed. The equivalent circuit layers are fit using the INPHAZE Dielectric Structure Refinement software.
- Uploaded on | 3 Views
-
 slavolyuba
About Analysis of Nanostructural Layers using Low Frequency Impedance Spectroscopy: A Case Study on Self-Assembled Alkane Layers on Silicon
PowerPoint presentation about 'Analysis of Nanostructural Layers using Low Frequency Impedance Spectroscopy: A Case Study on Self-Assembled Alkane Layers on Silicon'. This presentation describes the topic on This paper presents a detailed analysis of self-assembled alkane layers on silicon using low frequency impedance spectroscopy. The actual impedance data for a tetradecane film on silicon wafer electrolyte is examined and a 2 layer circuit model is proposed. The equivalent circuit layers are fit using the INPHAZE Dielectric Structure Refinement software.. The key topics included in this slideshow are Nanostructural layers, low frequency impedance spectroscopy, self-assembled alkane layers, silicon wafer, dielectric structure refinement,. Download this presentation absolutely free.
Presentation Transcript
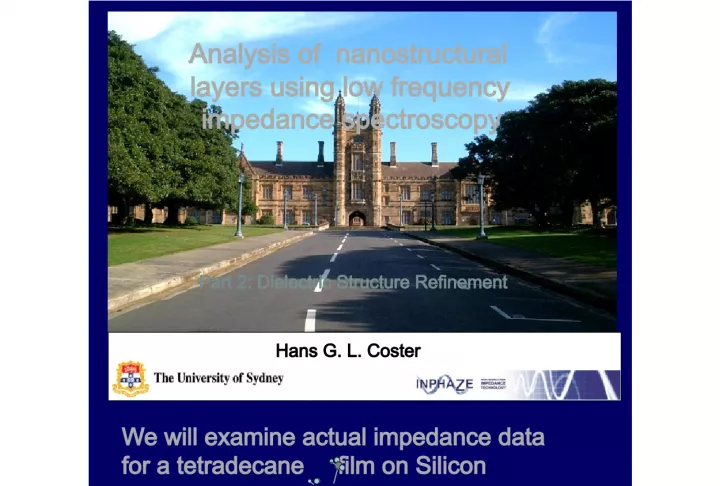
1. Analysis of nanostructural layers using low frequency impedance spectroscopy Hans G. L. Coster Part 2: Dielectric Structure Refinement
2. We will examine actual impedance data for a tetradecane film on Silicon Silicon wafer Electrolyte The equivalent 2 layer circuit model
3. Self Assembled Alkane layers on Si Presentation of actual data and fitting of equivalent circuit layers using the INPHAZE Dielectric Structure Refinement software
4. Tetradecane SAM on Silicon Set the area of the sample Set the minimum systematic error Start fitting with 1 layer and fit up to 2 layers Initiate fitting View the model structure Model and data plot
5. Structure of the SAM Note the large differences in the conductance Characteristic Frequency typical of electrolyte Characteristic Frequency typical of a thin, insulating layer Known dielectric constants Dimensions and conductivity of layers Alkane layer is 1.7 nm thick
6. Zooming to reveal details of fitting Left click-drag to outline zoom area
7. Expanded view reveals additional structure Overall good fit but towards the characteristic frequency of the electrolyte an additional layer may be required to fit detail
8. Examples of other representations of the data Impedance vs frequency Not very sensitive to model parameters Dielectric plot (real vs imaginary admittance)
9. Refining the model Reduce the minimum systematic error Force the software to fit with 3 layers Fit with 3 layers Old Fit with 2 layers Zoom to reveal detail
10. Refined structure View the new model
11. The model structure New layer Slightly modified dielectric parameters for the main SAM layer Frequency constant of additional layer Additional layer is at the SAM-electrolyte interface and might have a slightly elevated dielectric constant New layer is ~ 0.2 nm
12. The structure of the molecular layer 1.70 nm 1.68 nm 0.1-0.2 nm Very thin (< 0.2 nm) interfacial layer The cruder 2 layer model (alkane SAM + solution) yields the same overall dimensions for the SAM as the 3 layer model Deduced from the 2 layer model Deduced from the 3 layer model Silicon wafer
13. Impedance spectra for several alkane layers on Si C 10 C 12 C 14 C 16 C 18 The dimensions of these layers can be deduced to within atomic resolution!
14. Si-SiO 2 Presentation of actual data and fitting of equivalent circuit layers using the INPHAZE Dielectric Structure Refinement software
15. SiO 2 on Si SiO 2 Electrolyte Solution Silicon highly conducting Data for the Si-SiO2- electrolyte system Data fitted: yields a 2 layer circuit model
16. Dielectric properties of the glass layer SiO 2 layer is 3.1 nm Note the large differences in the conductance Characteristic Frequency typical of electrolyte Characteristic Frequency typical of a thin, insulating layer Known dielectric constants
17. Multilayered structures Multilayered structures manifest a more complicated dispersion of capacitance and conductance with frequency The individual layers can be determined from data over a sufficiently large frequency range
18. Hybrid Bilayer Lipid Membrane formed by adsorption of lipid vesicles on hydrophobic alkyl monolayers Silicon substrate (111 surface) Alkyl monolayer covalently bonded to Si Monolayer of lipids Attached by hydrophobic forces
19. Alkyl monolayer Hybrid Bilayer Impedance spectroscopy of Hybrid Bilayers Fitting the data yields the individual dielectric parameters of the layers
20. Detailed dielectric structure of Lipid Bilayers
21. Lecithin Lecithin + Cholesterol Lipid Bi-Molecular Membranes: the core matrix of cell membranes
22. The effect of cholesterol using the INPHAZE Dielectric Modeling software
23. Locating the cholesterol molecule O P O O - O N + O O O O H O P O O - O N + O O O O P O O - O N + O O O O P O O - O N + O O O O P O O - O N + O O O O P O O - O N + O O O O P O O - O N + O O O O P O O - O N + O O O From the changes in the capacitance and conductances of the various layers, it is possible locate the cholesterol molecule in the lipid bilayer. As the cholesterol is oxidised (either in situ or by using the oxidised form) the molecule moves out towards the surface. O H
24. The Spectrometer Impedance range: 0.1 -10 10 Frequency: < 10 -2 10 6 Hz Impedance precision: 0.002% Phase resolution: 0.001 o Inphaze.com.au
25. inphaze.com.au