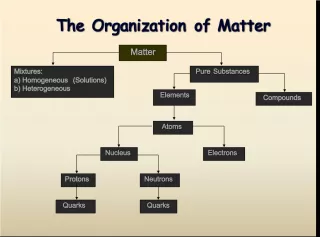
Understanding Ecology: Levels of Organization and Biosphere

Ecology is the scientific study of how living organisms interact with each other and with their environment. This field of study helps us understand the intricate relationships that exist in nature and how they impact
- Uploaded on | 1 Views
-
 tomer
tomer
About Understanding Ecology: Levels of Organization and Biosphere
PowerPoint presentation about 'Understanding Ecology: Levels of Organization and Biosphere'. This presentation describes the topic on Ecology is the scientific study of how living organisms interact with each other and with their environment. This field of study helps us understand the intricate relationships that exist in nature and how they impact. The key topics included in this slideshow are . Download this presentation absolutely free.
Presentation Transcript
Slide1EcologyEcology
Slide2•Ecology is the study of the interactions of living organisms with one another and with their physical environment (soil, water, climate…) • ECO = • LOGY = What is ecology? What is ecology? house the study of
Slide3LEVELS OF ORGANIZATION LEVELS OF ORGANIZATION Species Population Community Ecosystem Biome Biosphere
Slide4BiosphereBiosphere • The biosphere contains the combined portions of the planet in which all of life exists, including land, water and atmosphere.
Slide6ENERGY FLOW ENERGY FLOW • Every organism needs… …ENERGY!!!
Slide7ENERGY FLOW ENERGY FLOW • What are autotrophs? • Organisms that capture energy from the sun or chemicals to produce their own food.
Slide8ENERGY FLOW ENERGY FLOW • What is a producer? • Organisms that first capture energy (Autotrophs) • FIRST TROPHIC LEVEL
Slide9ENERGY FLOW ENERGY FLOW • During photosynthesis, autotrophs use light energy to power chemical reactions that convert CO 2 and water into oxygen and high energy sugars (glucose).
Slide10PRODUCERSPRODUCERS LAND: Plants UPPER LAYERS OF OCEAN: Algae TIDAL FLATS/SALT MARSHES: Photosynthetic bacteria / cyanobacteria
Slide11CHEMOSYNTHESIS CHEMO SYNTHESIS • Chemosynthesis is the process by which organisms use CHEMICAL energy to PRODUCE carbohydrates. • Making food without sunlight! – Example: Bacteria
Slide12ENERGY FLOW ENERGY FLOW • If AUTOTROPHS are called PRODUCERS, because they make their own food, what are HETEROTROPHS called?
Slide13CONSUMERSCONSUMERS • Organisms that consume plants or other organisms to obtain energy. • All organisms that are NOT producers!!! (Heterotrophs) • Three categories – Primary – Secondary – Tertiary
Slide14PRIMARY CONSUMERS PRIMARY CONSUMERS • Herbivores – Eat plants or other primary producers • Examples – Cows – Horses – Rabbits – Some Insects • SECOND TROPHIC LEVEL
Slide15SECONDARY CONSUMERS SECONDARY CONSUMERS • Carnivores – Animals that eat animals – Examples: tigers, wolves, snakes • Omnivores – Animals that are herbivores and carnivores – Examples: bears, humans • THIRD TROPHIC LEVEL
Slide16TERTIARY CONSUMERS TERTIARY CONSUMERS • Carnivores that consume other carnivores • Known as “top carnivores” • Example: – A hawk that eats a snake – A lion that eats a hyena • FOURTH TROPHIC LEVEL
Slide17DETRITOVORESDETRITOVORES • Decomposes organic material and returns the nutrients to the soil, water and air (making it available for other organisms). • Examples: mites, earthworms, snails, crabs
Slide18DECOMPOSERSDECOMPOSERS • Break down and absorb nutrients from dead organisms • They cause decay • Decomposition of bodies and wastes releases nutrients back into the environment to be recycled by other organisms. • Examples: bacteria, fungi
Slide19SCAVENGERSSCAVENGERS • Do not kill their food—they search for a source of food that is already dead • “Clean-up” the ecosystem • Examples: buzzards
Slide20FEEDING RELATIONSHIPS FEEDING RELATIONSHIPS • Energy flows through an ecosystem in ONE direction: Sun (or inorganic chemicals) Autotrophs/Producers Heterotrophs/Consumers
Slide21FOOD CHAIN FOOD CHAIN • A food chain is a series of steps in which organisms transfer energy by eating or being eaten. • It is how energy moves through an ecosystem!
Slide22FOOD WEB FOOD WEB • A food web is a network of complex interactions formed by the feeding relationships among the various organisms in an ecosystem.
Slide23FOOD CHAIN vs. FOOD WEB FOOD CHAIN vs. FOOD WEB • A food web will link together all of the food chains in a particular ecosystem…
Slide24Aterrestrial food chain A marine food chain
Slide27TROPHIC LEVELS TROPHIC LEVELS • A trophic level is a step in a food chain or food web. • Different organisms are on different levels depending on their source of energy. • Where does energy come from? SUN
Slide28TROPHIC LEVELS TROPHIC LEVELS 1 st TROPHIC LEVEL Producers 2 nd TROPHIC LEVEL Primary Consumers 3 rd TROPHIC LEVEL Secondary Consumers 4 th TROPHIC LEVEL Tertiary Consumers
Slide29TROPHIC LEVELS TROPHIC LEVELS • A consumer in a food chain depends on the trophic level below it for energy.
Slide31ECOLOGICAL PYRAMIDS ECOLOGICAL PYRAMIDS • An ecological pyramid is a diagram that show the relative amounts of energy or matter contained within each trophic level of a food chain or food web.
Slide32ECOLOGICAL PYRAMIDS ECOLOGICAL PYRAMIDS • Only part of the energy stored in a trophic level is passed on to the next because organisms use much of the energy they con
Slide33ENERGY PYRAMID ENERGY PYRAMID • All energy originates from the sun (or inorganic chemicals). • Sunlight (radiant energy) is converted to digestible energy by plants during photosynthesis.
Slide34•When the plants are eaten, the energy is transferred to animals to sustain life. • Energy is transferred up the food chain. ENERGY PYRAMID ENERGY PYRAMID
Slide36THE RULE OF TENS THE RULE OF TENS • Only 10% of the energy in a trophic level is passed on to the next level…90% of the energy is lost—where does it go? • Given off as HEAT!!
Slide38BIOMASS PYRAMID BIOMASS PYRAMID • Biomass is the total amount of living tissue within a trophic level. • Represents the amount of potential food available at each trophic level.
Slide39PYRAMID OF NUMBERS PYRAMID OF NUMBERS • Shows relative number of individual organisms at each trophic level.
Slide43LIMITATIONS OF TROPHIC LEVELS LIMITATIONS OF TROPHIC LEVELS Why can there not be too many links to one food chain?
Slide44•Each trophic level can support about one-tenth the amount of living tissue as the level below it, because only 10% of the energy is passed up!!!
Slide45A few more things… A few more things…
Slide46HABITATHABITAT • The area where an organism lives • Includes both biotic and abiotic factors
Slide47Biotic vs. Abiotic Biotic vs. Abiotic Biotic • Bio- means: life • Tic- means: pertaining to Biotic factors are the living organisms in a habitat! Abiotic • • Bio- means: life • • Tic- means: pertaining to • • A- means: no, not Abiotic factors are all the physical aspect of a habitat! Examples: soil, water, weather
Slide48Abiotic Factors Abiotic Factors • Water • Air • • Soil • • Heat • • Light