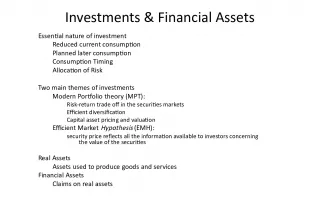
Understanding Investment Returns and Risk

Chapter 6 covers the basics of investment returns and risk concepts, including stand-alone and portfolio risks, as well as the Capital Asset Pricing Model (CAPM) and the Security Market Line (SML). Investment returns can be measured in dollar or percentage terms and may be historical or prospective.
- Uploaded on | 1 Views
-
 gabriellemorin
About Understanding Investment Returns and Risk
PowerPoint presentation about 'Understanding Investment Returns and Risk'. This presentation describes the topic on Chapter 6 covers the basics of investment returns and risk concepts, including stand-alone and portfolio risks, as well as the Capital Asset Pricing Model (CAPM) and the Security Market Line (SML). Investment returns can be measured in dollar or percentage terms and may be historical or prospective.. The key topics included in this slideshow are . Download this presentation absolutely free.
Presentation Transcript
1. 1 CHAPTER 6 Risk, Return, and the Capital Asset Pricing Model
2. 2 Topics in Chapter Basic return concepts Basic risk concepts Stand-alone risk Portfolio (market) risk Risk and return: CAPM/SML
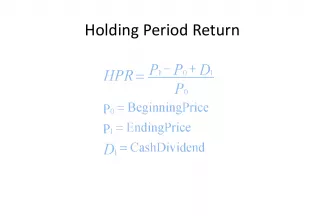
3. 3 What are investment returns? Investment returns measure the financial results of an investment. Returns may be historical or prospective (anticipated). Returns can be expressed in: Dollar terms. Percentage terms.
4. 4 An investment costs $1,000 and is sold after 1 year for $1,100. Dollar return: Percentage return: $ Received - $ Invested $1,100 - $1,000 = $100. $ Return/$ Invested $100/$1,000 = 0.10 = 10%.
5. 5 What is investment risk? Typically, investment returns are not known with certainty. Investment risk pertains to the probability of earning a return less than that expected. The greater the chance of a return far below the expected return, the greater the risk.
6. 6 Probability Distribution: Which stock is riskier? Why?
7. 7 Consider the Following Investment Alternatives Econ. Prob. T-Bill Alta Repo Am F. MP Bust 0.10 8.0% -22.0% 28.0% 10.0% -13.0% Below avg. 0.20 8.0 -2.0 14.7 -10.0 1.0 Avg. 0.40 8.0 20.0 0.0 7.0 15.0 Above avg. 0.20 8.0 35.0 -10.0 45.0 29.0 Boom 0.10 8.0 50.0 -20.0 30.0 43.0 1.00
8. 8 What is unique about the T- bill return? The T-bill will return 8% regardless of the state of the economy. Is the T-bill riskless?
9. 9 Alta and Repo vs. the Economy Alta Inds. moves with the economy, so it is positively correlated with the economy. This is the typical situation. Repo Men moves counter to the economy. Such negative correlation is unusual.
10. 10 Calculate the expected rate of return on each alternative. r = expected rate of return. r Alta = 0.10(-22%) + 0.20(-2%) + 0.40(20%) + 0.20(35%) + 0.10(50%) = 17.4%. ^ ^ n r = ^ i=1 r i P i .
11. 11 Alta has the highest rate of return. Does that make it the best? ^ r Alta 17.4% Market 15.0 Am. Foam 13.8 T-bill 8.0 Repo 1.7
12. 12 What is the standard deviation of returns for each alternative? = Standard deviation = Variance = 2 n i=1 = (r i r) 2 P i . ^
13. 13 = [(-22 - 17.4) 2 0.10 + (-2 - 17.4) 2 0.20 + (20 - 17.4) 2 0.40 + (35 - 17.4) 2 0.20 + (50 - 17.4) 2 0.10] 1/2 = 20.0%. Standard Deviation of Alta Industries
14. 14 T-bills = 0.0%. Alta = 20.0%. Repo = 13.4%. Am Foam = 18.8%. Market = 15.3%. Standard Deviation of Alternatives
15. 15 Stand-Alone Risk Standard deviation measures the stand- alone risk of an investment. The larger the standard deviation, the higher the probability that returns will be far below and above the expected return.
16. 16 Expected Return versus Risk Security Expected Return Risk, Alta 17.4% 20.0% Market 15.0 15.3 Am. Foam 13.8 18.8 T-bills 8.0 0.0 Repo 1.7 13.4
17. 17 Return vs. Risk (Std. Dev.): Which investment is better?
18. 18 How are betas calculated? In addition to measuring a stocks contribution of risk to a portfolio, beta also measures the stocks volatility relative to the market.
19. 19 Using a Regression to Estimate Beta Run a regression with returns on the stock in question plotted on the Y axis and returns on the market portfolio plotted on the X axis. The slope of the regression line, which measures relative volatility, is defined as the stocks beta coefficient, or b.
20. 20 Use the historical stock returns to calculate the beta for PQU. Year Market PQU 1 25.7% 40.0% 2 8.0% -15.0% 3 -11.0% -15.0% 4 15.0% 35.0% 5 32.5% 10.0% 6 13.7% 30.0% 7 40.0% 42.0% 8 10.0% -10.0% 9 -10.8% -25.0% 10 -13.1% 25.0%
21. 21 Calculating Beta for PQU
22. 22 What is beta for PQU? The regression line, and hence beta, can be found using a calculator with a regression function or a spreadsheet program. In this example, b = 0.8303.
23. 23 Calculating Beta in Practice Many analysts use the S&P 500 to find the market return. Analysts typically use four or five years of monthly returns to establish the regression line. Some analysts use 52 weeks of weekly returns.
24. 24 How is beta interpreted? If b = 1.0, stock has average risk. If b > 1.0, stock is riskier than average. If b < 1.0, stock is less risky than average. Most stocks have betas in the range of 0.5 to 1.5.
25. 25 Other Web Sites for Beta Go to http://finance.yahoo.com Enter the ticker symbol for a Stock Quote, such as IBM or Dell, then click GO. When the quote comes up, select Key Statistics from panel on left.
26. 26 Expected Return versus Market Risk: Which investment is best? Security Expected Return (%) Risk, b Alta 17.4 1.29 Market 15.0 1.00 Am. Foam 13.8 0.68 T-bills 8.0 0.00 Repo Men 1.7 -0.86
27. 27 CAPM model r i = r RF + (RP M )b i . Assume r RF = 8%; r M = 15%. RP M = (r M - r RF ) = 15% - 8% = 7%.
28. 28 Required Rates of Return r Alta = 8.0% + (7%)(1.29) = 17%. r M = 8.0% + (7%)(1.00) = 15.0%. r Am. F. = 8.0% + (7%)(0.68) = 12.8%. r T-bill = 8.0% + (7%)(0.00) = 8.0%. r Repo = 8.0% + (7%)(-0.86) = 2.0%.
29. 29 Expected versus Required Returns (%) Exp. Req. r r Alta 17.4 17.0 Undervalued Market 15.0 15.0 Fairly valued Am. Foam 13.8 12.8 Undervalued T-bills 8.0 8.0 Fairly valued Repo 1.7 2.0 Overvalued
30. 30 SML: r i = r RF + (RP M ) b i r i = 8% + (7%) b i . . Repo . Alta T-bills . Am. Foam r M = 15 r RF = 8 -1 0 1 2 . r i (%) Risk, b i Market
31. Homework Assignment Problems: 2,3,4,5 (a, b), 6