Systems Prognostic Health Management: An Overview

This article provides an overview of systems prognostic health management, including its importance in improving reliability and decreasing maintenance costs. The author, Christopher Thompson, also shares his engineering experience in the field.
- Uploaded on | 0 Views
-
 sashamiller
About Systems Prognostic Health Management: An Overview
PowerPoint presentation about 'Systems Prognostic Health Management: An Overview'. This presentation describes the topic on This article provides an overview of systems prognostic health management, including its importance in improving reliability and decreasing maintenance costs. The author, Christopher Thompson, also shares his engineering experience in the field.. The key topics included in this slideshow are systems prognostic health management, reliability, maintenance, engineering, Lockheed Martin,. Download this presentation absolutely free.
Presentation Transcript
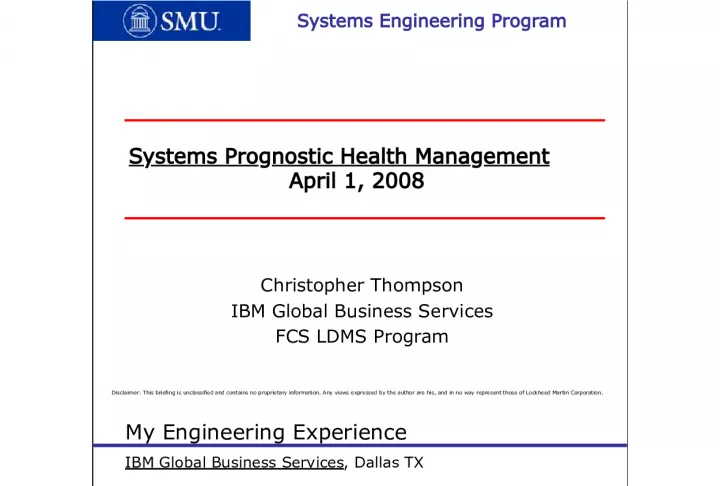
1. Systems Prognostic Health Management April 1, 2008 Christopher Thompson IBM Global Business Services FCS LDMS Program Systems Engineering Program Disclaimer: This briefing is unclassified and contains no proprietary information. Any views expressed by the author are his, and in no way represent those of Lockheed Martin Corporation.
2. 2 My Engineering Experience IBM Global Business Services , Dallas TX Requirements Lead/Prognostics SME FCS Logistics Data Management Service (LDMS) Lockheed Martin Missiles and Fire Control , Dallas TX Senior Systems Engineer - Multifunction Utility/Logistics Equipment (MULE) Lockheed Martin Aeronautics , Fort Worth TX Vehicle Systems - Prognostic Health Management - F-35 Joint Strike Fighter (Lightning II) Lockheed Martin Missiles and Fire Control , Dallas TX Reliability Engineer - Army Tactical Missile System (TACMS) SMU School of Engineering , Dallas TX - TA for Dr. Stracener
3. 3 My Education B.S. in Electrical Engineering, SMU (1997) M.S. in Mechanical Engineering, SMU (2001) - Major: Fatigue/Fracture Mechanics M.S. in Systems Engineering (2002) - Major: Reliability, Statistical Analysis Ph.D. in Applied Science ( anticipated ~ 2009 ) - Major: Systems Engineering (PHM)
4. 4 My Dissertation Fleet Based Analysis of Mission Equipment Sensor Configuration and Coverage Optimization for Systems Prognostic Health Management
5. 5 Sensor Tradeoffs As more sensors are added to your system: GOOD BAD weight increases A 0 increases P(FDI) increases R(t) decreases TRADEOFFS power increases AUPC increases Life cost decreases MTTR decreases MTBUMA increases P(Prog) increases volume increases cabling increases
6. 6 PHM Optimization Operational Availability A O 0 # of Sensors N Cost* $ AUPC * Other metrics will include Weight/Volume, Power (K/W), Specants (Computing Power) LCC A O Optimum
7. 7 PHM Optimization Probability of Detection of Crack 0 x = mean distance between sensors X x = mean distance between sensors x x x structural element N = # of sensors 0 optimum solution
8. 8 For a common LRU (such as an engine), plotting engine power against against an environmental measure (such as temperature) over time: No Damage Mild Damage Moderate Damage Severe Damage Engine Internal Temp. Time Engine Power 200% spec limit 150% spec limit 125% spec limit 100% spec limit
9. 9 Estimating the damage accumulated (or life consumed) Mild Damage Moderate Damage Severe Damage x1 x2 x4 (or more) 150% specification limit 200% specification limit
10. Hypothetical engine air/oil/fuel filter performance over its life optimal performance engine system failure likely acceptable performance filter life (in miles) filter performance (flow rate) engine system damage likely degraded performance MTBF hazardous performance distribution of failure times
11. 11 Common LRU used on multiple vehicle types with platform specific (hidden) failure modes Why is the Failure Rate for the LRU in Platform 4 higher? What is different about Platform 4? Platform 1 Failure Rate Platform 2 Platform 3 Platform 4 statistically significant difference
12. 12 Standard oil filter used in engines across FCS vehicles, replaced at a scheduled time/miles Scheduled Replacement Time Actual Condition of the oil filter Vehicle 1 Vehicle 2 Vehicle 3 Wearout Life Consumption wasted filter life Increased engine life consumption Correct action
13. 13 Standard structural element across several vehicles (under cyclic loading) Time (or miles, or load cycles, or on/off cycles, ) Damage Accumulation fleet based estimate Repair needed before estimate LRU life histories
14. 14 The MULE Program Future Combat Systems Multifunction Utility/Logistics Equipment
15. 15 Keys to the Success of FCS Reducing Logistics footprint Increasing Availability Reducing Total Cost of Ownership Implementing Performance Based Logistics Improvements in the ilities (RAM-T) Reliability Availability Maintainability Testability Supportability
16. 16 Prognostics Of or relating to prediction; a sign of a future happening; a portent. The process of calculating an estimate of remaining useful life for a component, within sufficient time to repair or replace it before failure occurs.
17. 17 Prognostic Health Management (PHM) PHM is the integrated system of sensors which: Monitors system health, status and performance Tracks system consumables oil, batteries, filters, ammunition, fuel Tracks system configuration software versions, component life history Isolates faults/failures to their root causes Calculates remaining life of components
18. 18 Diagnostics The identification of a fault or failure condition of an element, component, sub-system or system, combined with the deduction of the lowest measurable cause of that condition through confirmation, localization, and isolation. Confirmation is the process of validation that a failure/fault has occurred, the filtering of false alarms, and assessment of intermittent behavior. Localization is the process of restricting a failure to a subset of possible causes. Isolation is the process of identifying a specific cause of failure, down to the smallest possible ambiguity group.
19. 19 Faults and Failures Fault : A condition that reduces an elements ability to perform its required function at desired levels, or degrades performance. Failure : The inability of a component, sub-system or system to perform its intended function. Failure may be the result of one or more faults. Failure Cascade : The result when a failure occurs in a system where the successful operation of a component depends on a preceding component, which can a failure can trigger the failure of successive parts, and amplify the result or impact.
20. 20 Classes of Failures Design Failures : These take place due to inherent errors or flaws in the system design. Infant Mortality Failures : These cause newly manufactured systems to fail, and can generally be attributed to errors in the manufacturing process, or poor material quality control. Random Failures : These can occur at any time during the entire life of a system. Electrical systems are more likely to fail in this manner. Wear-Out Failures : As a system ages, degradation will cause systems to fail. Mechanical systems are more likely to fail in this manner.
21. 21 The Ultimate Goal of Prognostics The aim of Prognostics is to maximize system availability and life consumption while minimizing Logistical Downtime and Mean Time To Repair, by predicting failures before they occur. This is a notional diagram indicative of a wear out failure.
22. 22 What is PHM? Prognostic Health Management (PHM) is the integrated hardware and software system which: Monitors system health, status and performance Tracks system consumables oil, batteries, filters, ammunition, fuel Tracks system configuration software versions, component life history Diagnoses/Isolates faults/failures to their root causes Calculates remaining life of components Predicts failures before they occur Continually updates predictive models with failure data
23. 23 What is PHM? Prognostic Health Management is a methodology for establishing system status and health, and projecting remaining life and future operational condition, by comparing sensor-based operational parameters to threshold values within knowledge base models. These PHM models utilize predictive diagnostics, fault isolation and corroboration algorithms, and knowledge of the operational history of the system, allowing users to make appropriate decisions about maintenance actions based on system health, logistics and supportability concerns and operational demands, to optimize such characteristics as availability or operational cost.
24. 24 PHM Stakeholders SYSTEMS ENGINEERING SOFTWARE & SIMULATION TEST ENGINEERING MECHANICAL ENGINEERING ELECTRICAL ENGINEERING TRAINING & PROD. SUPP. PHM Model Design Interface Management Requirements Development Sensor Optimization CAIV/WAIV Analysis Prognostic Trending System Architecture PHM Model Integration Software Interfaces Fault/Failure Simulation Continuous BIT/PHM Test Planning Fault/Failure Criticality Fault/Failure Propagation Fault/Failure Simulation Platform Integration Crack Growth Sensing Stress/Strain Sensing Corrosion Sensing Vibration Sensing Consumables Monitoring Acoustic Sensing Thermal Sensing Sensor Implementation Sensor Integration Data Management Data Architecture Reliability/ Failure Modes Maintainability & Testability Logistics & Sustainment Training Safety
25. 25 PHM Design Methodology
26. 26 PHM Design Methodology
27. 27 PHM Design Methodology
28. 28 PHM Design Methodology
29. 29 PHM Design Methodology
30. 30 Availability, Achieved where MTBF = Mean Time Between Failure MTTR = Mean Time To Repair Availability Analysis
31. 31 Availability, Operational where MTBUMA = Mean Time Between Unscheduled Maintenance Actions ALDT = Administrative Logistical Down Time MTTR = Mean Time To Repair Availability Analysis
32. 32 MTBUMA = Mean Time Between Unscheduled Maintenance Actions where MTBM = Mean Time Between Failures MTBM = Mean Time Between Maintenance Availability Analysis
33. 33 How can we improve A O ? - By decreasing Administrative & Logistical Down Time (ALDT) - By increasing Mean Time Between Failures (MTBF) - By decreasing Mean Time To Repair (MTTR) - By increasing Mean Time Between Unscheduled Maintenance Actions (MTBUMA) [by decreasing MTBR induced and MTBR no defect] Availability Analysis
34. 34 How can we decrease ALDT? - By improving Logistics Improve scheduling of inspections Improve commonality of parts Decrease time to get replacements - By improving Prognostics Replace parts before they fail, not after Maximize use of component life Improve off-board prognostics trending More sensors!! Availability Analysis
35. 35 How can we increase MTBF? - By improving Reliability Select more rugged components Improve life screening and testing Improve thermal management - By improving Quality Better parts screening Better manufacturing processes - By adding Redundancy At the cost of Size, Weight and Power! Availability Analysis
36. 36 How can we decrease MTTR? - By improving Maintainability Improve quality and efficacy training Simplify fault isolation Decrease number of tools and special equipment Decrease access time (panels, connectors) Improve Preventative Maintenance - By improving Diagnostics Improve BIT and BITE Decrease ambiguity group size Improve maintenance manuals and training Availability Analysis
37. 37 How can we increase MTBM (induced/no defect)? - By improving Safety Limit the potential for accidental damage - By improving Prognostics Improve PHM models to monitor induced damage - By improving Diagnostics Lower the false alarm rate Dont repair/replace things which arent broken! Availability Analysis