Steps and Issues in Chemical Analysis

This article focuses on the various steps involved in chemical analysis, including sampling, preparation, testing measurement, and data analysis. It also explores common errors that can occur during chemical analysis and the role of
- Uploaded on | 4 Views
-
 oscarwalker
About Steps and Issues in Chemical Analysis
PowerPoint presentation about 'Steps and Issues in Chemical Analysis'. This presentation describes the topic on This article focuses on the various steps involved in chemical analysis, including sampling, preparation, testing measurement, and data analysis. It also explores common errors that can occur during chemical analysis and the role of. The key topics included in this slideshow are . Download this presentation absolutely free.
Presentation Transcript
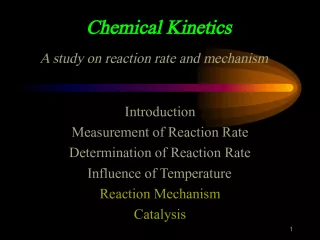
Slide13nd Meeting Chemical Analysis 3 nd Meeting Chemical Analysis Steps and issues Steps and issues
Slide2STEPS IN CHEMICAL ANALYSIS1. Sampling 2. Preparation 3. Testing/Measurement 4. Data analysis 2. Error in chemical analysis 3. Statistics for chemistry
Slide3SAMPLINGPrerequisite: sample should be representative Example: Main sample A B C Primary sample 1 4 3 2 2 + 3 1 + 4 d c b a a b c d Bulk sample Sub-bulk sample Lab sample
Slide4Preparation for Solid Sample1. Wet Digesting • Direct solvation with water • Solvation with: oxydator acids (HNO3, H 2 SO 4 , HCl, HClO 4 , its mixtures) and base. • Destruction with aqua regia: HNO 3 : HCl = 1 : 3. 2. Dry digesting Ashing (Furnace) in certain temperature (+ “ ashing aid”. if necessary), solving in acids, and diluting quantitatively
Slide5TESTING/MEASUREMENTPurpose : Qualitative and quantitative analysis Qualitative Analysis: Spot test Analysis Quantitative Analysis: Conventional Methods : Volumetri dan Gravimetri Physico-chemical methods (modern) : Elektrokimia , Spektrofotometri
Slide6Calculatioan and Data InterpretationDATA CAN BE ACHIEVED (quantitative analysis): volume, (volumetric), mass, (Gravimetric) Absorption (Spectrometric) Potential Cell (Electrochem) Should be changed in to Concentration, (M, ppm) content (% mass/mass , % vol/mass)
Slide7Every steps in analysis stepsalways face error . Need Statistic calculation to help in decision making Error in data interpretation
Slide8Error in chemical analysis1. Indeterminat e Error error can be exactly defined Examples : - Noise and deviation in electronic circuits - Vibration of building - environment change 2. Determina te Error /Systematical error - Error in methods : Interfere agents ( can be + or -) 3. Opera t ional Error : Operators/Analysts 4. Instrumental Error: Uncalibated/ un-standardized instruments
Slide9Relative Error True value – measurement value % Error = x 100% True value
Slide10Simple Statistics in chemical analysis1. Mean (harga rata-rata, x ), x 1 + x 2 + x 3 + ... + x n X = n 2. Standard Deviation (S), Variability of analysis result ( x – x ) 2 S = n – 1 JK S = n - 1
Slide113.Relative Standard Deviation (R.S.D) s R.S.D = x 4. Coefficient of Variation (C.V.) s x 100 C.V. = x Example : Analysis of iron ores produce % mass of Iron: 7,08 ; 7,21 ; 7,12 ; 7,09 ; 7,16 ; 7,14 ; 7,07 ; 7,14 ; 7,18 ; 7,11. Calculate: means , Standard of deviation, and coefficient of variation ! Jawab : X = 7,13 % ; s = 0,045 % ; C.V. = 0,63%
Slide125.Batas Kepercayaan, merupakan daerah di sekitar harga yang sesungguhnya = x + t (s x ) s s x = n Nilai t diperoleh dari Tabel t pada derajat kebebasan (D.B.) = n - 1 Contoh: Hasil analisis massa nikel (mg) yang terkandung dalam 1 g suatu bahan galian adalah : 5,0 ; 5,3 ; 5,7 ; 4,8 ; 5,2 Hitung batas kepercayaan pada tingkat kepercayaan 95%
Slide13ANSWERANSWER • x = 5,2 ; s = 0,3 ; s x = 0,134 • x = 5,2 ; s = 0,3 ; s x = 0,134 • = 5,20 + 0,37 So 95% believe that % mass of Iron is between : 4,83 – 5,57. • = 5,20 + 0,37 So 95% believe that % mass of Iron is between : 4,83 – 5,57.
Slide148.Presisi on The similarity of value/data in one set of data , shown by standard of deviation 9 . A curation The nearness of data measurement to the true value
Slide15 x xxx x x x xx x X X X X X X X X X X A B C D
Slide16 x xxx x x x xx x X X X X X X X X X X A B C D Keterangan: A : Presisi baik, akurasi baik B : Presisi baik, akurasi tidak baik C : Presisi tidak baik, akurasi baik (rata-rata) D : Presisi tidak baik, akurasi tidak baik
Slide17SEKIAN DULUTerima Kasih