Introduction to Inequalities Warm-Up

This lesson presentation is designed to introduce students to the concept of inequalities in mathematics. The warm-up section includes four equations to solve, each of which involves different variables and inequality symbols. The lesson
- Uploaded on | 5 Views
-
 johanne
About Introduction to Inequalities Warm-Up
PowerPoint presentation about 'Introduction to Inequalities Warm-Up'. This presentation describes the topic on This lesson presentation is designed to introduce students to the concept of inequalities in mathematics. The warm-up section includes four equations to solve, each of which involves different variables and inequality symbols. The lesson. The key topics included in this slideshow are . Download this presentation absolutely free.
Presentation Transcript
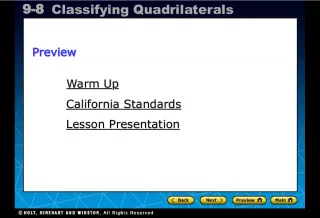
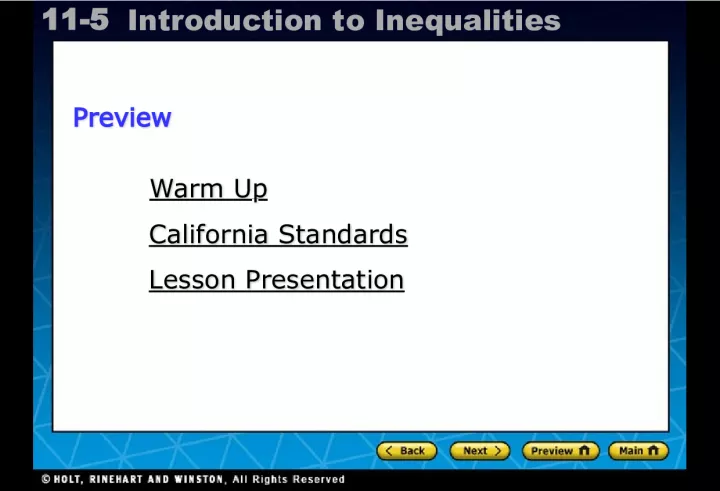
Slide1Holt CA Course 111-5 Introduction to Inequalities Warm Up Warm Up California Standards California Standards Lesson Presentation Lesson Presentation Preview Preview
Slide2Holt CA Course 111-5 Introduction to Inequalities Warm Up Solve. 1. – 21 z + 12 = –27 z 2. –12 n – 18 = –6 n 3. 12 y – 56 = 8 y 4. –36 k + 9 = –18 k z = –2 n = –3 y = 14 k = 1 2
Slide3Holt CA Course 111-5 Introduction to Inequalities Preview of Grade 7 AF1.1 Use variables and appropriate operations to write an expression, an equation , an inequality, or a system of equations, or inequalities that represents a verbal description (e.g., three less than a number, half as large as area A ). California Standards
Slide4Holt CA Course 111-5 Introduction to Inequalities Vocabulary inequality algebraic inequality solution set compound inequality
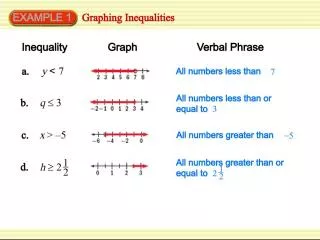
Slide5Holt CA Course 111-5 Introduction to Inequalities An inequality is a statement that compares two expressions by using one of the following symbols: <, >, ≤, ≥, or . Symbol Meaning Word Phrases < > ≤ ≥ is less than is greater than is greater than or equal to is less than or equal to Fewer than, below More than, above At most, no more than At least, no less than
Slide6Holt CA Course 111-5 Introduction to Inequalities An inequality that contains a variable is an algebraic inequality . A value of the variable that makes the inequality true is a solution of the inequality. An inequality may have more than one solution. Together, all of the solutions are called the solution set . You can graph the solutions of an inequality on a number line. If the variable is “greater than” or “less than” a number, then that number is indicated with an open circle.
Slide7Holt CA Course 111-5 Introduction to Inequalities A compound inequality is the result of combining two inequalities. The words and and or are used to describe how the two parts are related. x > 3 or x < –1 –2 < y and y < 4 x is either greater than 3 or less than–1. y is both greater than –2 and less than 4. y is between –2 and 4. The compound inequality –2 < y and y < 4 can be written as –2 < y < 4. Writing Math
Slide8Holt CA Course 111-5 Introduction to Inequalities This open circle shows that 5 is not a solution. a > 5 If the variable is “greater than or equal to” or “less than or equal to” a number, that number is indicated with a closed circle. This closed circle shows that 3 is a solution. b ≤ 3
Slide9Holt CA Course 111-5 Introduction to Inequalities Write an inequality for each situation. Additional Example 1: Writing Inequalities A. There are at least 15 people in the waiting room. number of people ≥ 15 B. The tram attendant will allow no more than 60 people on the tram. number of people ≤ 60 “At least” means greater than or equal to. “No more than” means less than or equal to.
Slide10Holt CA Course 111-5 Introduction to Inequalities Graph each inequality. Additional Example 2: Graphing Simple Inequalities –3 –2 –1 0 1 2 3 A. n < 3 Draw an open circle at 3. The solutions are values of n less than 3, so shade to the left of 3. B. a ≥ –4 –6 –4 –2 0 2 4 6 Draw a closed circle at –4. The solutions are –4 and values of a greater than –4, so shade to the right of –4.
Slide11Holt CA Course 111-5 Introduction to Inequalities Graph each compound inequality. Additional Example 3: Graphing Compound Inequalities 0 1 2 3 4 5 6 1 2 3 4 5 6 – – – – – – A . m ≤ –2 or m > 1 Graph m ≤ –2 Graph m > 1 Include the solutions shown by either graph. 0 2 4 6 2 4 6 – – – • 0 2 4 6 –2 –4 –6 º
Slide12Holt CA Course 111-5 Introduction to Inequalities Write an inequality for each situation. Check It Out! Example 1 A. There are at most 10 gallons of gas in the tank. gallons of gas ≤ 10 B. There is at least 10 yards of fabric left. yards of fabric ≥ 10 “At most” means less than or equal to. “At least” means greater than or equal to.
Slide13Holt CA Course 111-5 Introduction to Inequalities Graph each inequality. Check It Out! Example 2 –3 –2 –1 0 1 2 3 A. p ≤ 2 Draw a closed circle at 2. The solutions are 2 and values of p less than 2, so shade to the left of 2. B. e > –2 –3 –2 –1 0 1 2 3 Draw an open circle at –2. The solutions are values of e greater than –2, so shade to the right of –2.
Slide14Holt CA Course 111-5 Introduction to Inequalities Lesson Quiz: Part I Write an inequality for each situation. 1. No more than 220 people are in the theater. 2. There are at least a dozen eggs left. 3. Fewer than 14 people attended the meeting. number of eggs ≥ 12 people in the theater ≤ 220 people attending the meeting < 14
Slide15Holt CA Course 111-5 Introduction to Inequalities Lesson Quiz: Part II Graph the inequalities. 4. x > –1 0 º 1 3 5 1 2 3 – – – 5. x ≥ 4 or x < –1 0 º 1 3 5 1 3 5 – – – • Graph the compound inequality.