Extending CGMS for Drought Stress Mapping at Regional Scale

This article discusses the use of the Crop Growth Monitoring System (CGMS) to map drought stress at a regional scale. It also explores the impact of the European heat wave in summer 2003 on vegetation and the potential different impacts on various crops.
- Uploaded on | 1 Views
-
 ansley
About Extending CGMS for Drought Stress Mapping at Regional Scale
PowerPoint presentation about 'Extending CGMS for Drought Stress Mapping at Regional Scale'. This presentation describes the topic on This article discusses the use of the Crop Growth Monitoring System (CGMS) to map drought stress at a regional scale. It also explores the impact of the European heat wave in summer 2003 on vegetation and the potential different impacts on various crops.. The key topics included in this slideshow are CGMS, drought stress mapping, regional scale, European heat wave, vegetation impact, crop impact,. Download this presentation absolutely free.
Presentation Transcript
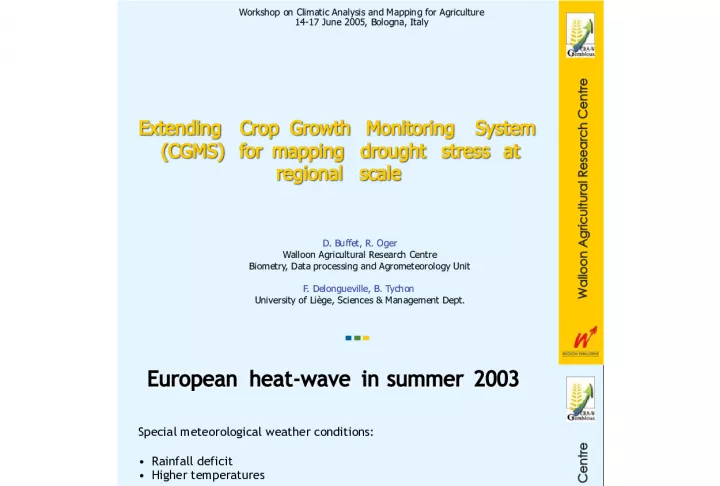
1. Walloon Agricultural Research Centre Extending Crop Growth Monitoring System (CGMS) for mapping drought stress at regional scale Extending Crop Growth Monitoring System (CGMS) for mapping drought stress at regional scale D. Buffet, R. Oger Walloon Agricultural Research Centre Biometry, Data processing and Agrometeorology Unit F. Delongueville, B. Tychon University of Lige, Sciences & Management Dept. Workshop on Climatic Analysis and Mapping for Agriculture 14-17 June 2005, Bologna, Italy
2. Walloon Agricultural Research Centre Walloon Agricultural Research Centre (CRA-W) Biometry, Data processing and Agrometeorology Unit buffet@cra.wallonie.be oger@cra.wallonie.be European heat-wave in summer 2003 European heat-wave in summer 2003 August 2003 CNES The effects of the drought on vegetation in August 2003 is clearly visible at a global scale. Special meteorological weather conditions: Rainfall deficit Higher temperatures But similar or different impacts on various crops ?
3. Walloon Agricultural Research Centre Walloon Agricultural Research Centre (CRA-W) Biometry, Data processing and Agrometeorology Unit buffet@cra.wallonie.be oger@cra.wallonie.be Belgian conditions in 2003 Belgian conditions in 2003 In Belgium, for specific crops, productivities were similar or better in 2003 than 2002 !! Relative difference (%) between productivity in July 2003 with the same period in 2002. (Derived from SPOT-VGT images and meteorological data). This can be explained by earlier maturity due to climatic conditions more favorable than last year at the same time. Decade DVS (Phenological Index) Monitoring drought stress spatially and temporally 2003 2002
4. Walloon Agricultural Research Centre Walloon Agricultural Research Centre (CRA-W) Biometry, Data processing and Agrometeorology Unit buffet@cra.wallonie.be oger@cra.wallonie.be What is drought? What is drought? Drought is a temporary protracted period of deficient (unusual) in water or moisture availability. 3 different droughts can be considered; Meteorological, Hydrological and Agricultural droughts. (sources FAO & NDMC) Agricultural Drought: Agricultural Drought: Agricultural drought occurs when there is not enough soil moisture to meet the needs of a particular crop at a particular time and in a particular place resulting in extensive damage to crops . It is the impact of meteorological and/or hydrological droughts on crop yields and quality. => Rainfall & Soil Moisture Monitoring Different impacts depending on the crop Different impacts depending on the phenological stage Spatialised Drought Index based on soil moisture deficit ratio and specific to crops and their growth cycle
5. Walloon Agricultural Research Centre Walloon Agricultural Research Centre (CRA-W) Biometry, Data processing and Agrometeorology Unit buffet@cra.wallonie.be oger@cra.wallonie.be An integrated system : B-CGMS An integrated system : B-CGMS The aim of B-CGMS is to provide the Belgian authorities with reliable, timely and objective estimations of crop yields / productions at regional and national scales. Based on the EU-CGMS (MARS JRC) B-CGMS = Agrometeorological model + Remote Sensing + Statistics B-CGMS monitors crop development, driven by: 1. meteorological conditions 2. soil characteristics 3. crop parameters 4. satellite data 5 main crops + grasslands monitored at regional & national scales
6. Walloon Agricultural Research Centre Walloon Agricultural Research Centre (CRA-W) Biometry, Data processing and Agrometeorology Unit buffet@cra.wallonie.be oger@cra.wallonie.be Extending B-CGMS for mapping drought stress at regional scale Extending B-CGMS for mapping drought stress at regional scale 14 480 Elementary Mapping Units for Belgium Grid weather Soil Mapping Units Administrative limits
7. Walloon Agricultural Research Centre Walloon Agricultural Research Centre (CRA-W) Biometry, Data processing and Agrometeorology Unit buffet@cra.wallonie.be oger@cra.wallonie.be Extending B-CGMS for mapping drought stress at regional scale Extending B-CGMS for mapping drought stress at regional scale Development and integration of a Drought Stress Indicator using B-CGMS information (input and output data). Meteorological data Availability of spatially accurate soil characteristics Availability of spatially land-use/land-cover 5 main crops + grasslands parameters Spatial information Time series (Monitoring) Drought Stress Index
8. Walloon Agricultural Research Centre Walloon Agricultural Research Centre (CRA-W) Biometry, Data processing and Agrometeorology Unit buffet@cra.wallonie.be oger@cra.wallonie.be Step 1: Relative Soil Moisture Index [RSMI] Step 1: Relative Soil Moisture Index [RSMI] t - wp RSMI = fc - wp Actual soil moisture content [cm3 cm-3] Soil moisture content at wilting point [cm3 cm-3] Soil moisture content at field capacity [cm3 cm-3] Relative Soil Moisture Index [%]
9. Walloon Agricultural Research Centre Walloon Agricultural Research Centre (CRA-W) Biometry, Data processing and Agrometeorology Unit buffet@cra.wallonie.be oger@cra.wallonie.be B-CGMS Soil Moisture (inputs) B-CGMS Soil Moisture (inputs) wp fc Volumetric soil water content as a function of pressure head h sat = 0,81 + 0,0013*C - 0,283*BD [cm/cm] r = 0,015 + 0,005*C + 0,0139*OC [cm/cm] ln( ) = -2,486 + 0,025/ S - 0,023*C - 0,351*OC - 2,617*BD ln(n) = 0,053 - 0,009*S - 0,013*C + 0,00015*S Vereecken Pedotransfert functions
10. Walloon Agricultural Research Centre Walloon Agricultural Research Centre (CRA-W) Biometry, Data processing and Agrometeorology Unit buffet@cra.wallonie.be oger@cra.wallonie.be Relative Soil Moisture Index [RSMI] Relative Soil Moisture Index [RSMI] t - wp RSMI = fc - wp Actual soil moisture content [cm3 cm-3] Relative Soil Moisture Index [%]
11. Walloon Agricultural Research Centre Walloon Agricultural Research Centre (CRA-W) Biometry, Data processing and Agrometeorology Unit buffet@cra.wallonie.be oger@cra.wallonie.be B-CGMS Soil Moisture (outputs) B-CGMS Soil Moisture (outputs) Crops Weather Soil Temporal t
12. Walloon Agricultural Research Centre Walloon Agricultural Research Centre (CRA-W) Biometry, Data processing and Agrometeorology Unit buffet@cra.wallonie.be oger@cra.wallonie.be Step 2: Soil Moisture Deficit Threshold [T] Step 2: Soil Moisture Deficit Threshold [T] Forage Maize: T = 0.50 Winter Wheat: T = 0.55 RSMI < T Drought Stress RSMI >= T No Drought Stress Soil moisture deficit threshold is crop specific
13. Walloon Agricultural Research Centre Walloon Agricultural Research Centre (CRA-W) Biometry, Data processing and Agrometeorology Unit buffet@cra.wallonie.be oger@cra.wallonie.be Step 3: Crop Sensitive Period [SP] Step 3: Crop Sensitive Period [SP] Phenological development stages come from B-CGMS outputs Forage Maize: SP = anthesis +/- 15 days ( 5 weeks) Winter wheat: SP = From Stem elongation to grain filling ( 8 weeks) Water stress is crop specific and is function of the crop phenological development stage.
14. Walloon Agricultural Research Centre Walloon Agricultural Research Centre (CRA-W) Biometry, Data processing and Agrometeorology Unit buffet@cra.wallonie.be oger@cra.wallonie.be Step 4: Drought Stress Index [DSI] Step 4: Drought Stress Index [DSI] DSI is defined as the number of days affected by a water stress which occurred during a critical period and for a given crop Drought Stress Index = ( RSMI < T ) SP
15. Walloon Agricultural Research Centre Walloon Agricultural Research Centre (CRA-W) Biometry, Data processing and Agrometeorology Unit buffet@cra.wallonie.be oger@cra.wallonie.be Step 5: Aggregation into administrative limits Step 5: Aggregation into administrative limits 14 480 Elementary Mapping Units 14 Belgian Agricultural Regions 26 Belgian Agro-statistical Circumscriptions 570 Belgian Municipalities
16. Walloon Agricultural Research Centre Walloon Agricultural Research Centre (CRA-W) Biometry, Data processing and Agrometeorology Unit buffet@cra.wallonie.be oger@cra.wallonie.be DSI: detect water stress by crops DSI: detect water stress by crops Winter Wheat Forage Maize Drought Stress Index 2003
17. Walloon Agricultural Research Centre Walloon Agricultural Research Centre (CRA-W) Biometry, Data processing and Agrometeorology Unit buffet@cra.wallonie.be oger@cra.wallonie.be DSI: Spatial comparaison DSI: Spatial comparaison Yield 2003/2002 (%) Drought Stress Index Drought Stress Index Yield 2003/2002 (%) 2003
18. Walloon Agricultural Research Centre Walloon Agricultural Research Centre (CRA-W) Biometry, Data processing and Agrometeorology Unit buffet@cra.wallonie.be oger@cra.wallonie.be DSI: Temporal comparaison DSI: Temporal comparaison 2002 2003 1976 Forage Maize Drought Stress Index
19. Walloon Agricultural Research Centre Walloon Agricultural Research Centre (CRA-W) Biometry, Data processing and Agrometeorology Unit buffet@cra.wallonie.be oger@cra.wallonie.be DSI: Water stress monitoring DSI: Water stress monitoring Week 18 Week 19 Week 20 Week 21 Week 22 Week 23 Forage Maize Drought Stress Index
20. Walloon Agricultural Research Centre Walloon Agricultural Research Centre (CRA-W) Biometry, Data processing and Agrometeorology Unit buffet@cra.wallonie.be oger@cra.wallonie.be Conclusion Conclusion Drought Stress Index allows : - Spatial water stress assessment (grid 10x10km or Administrative levels) - Temporal water stress assessment ( 10-day time step ) Useful tool for Administration : - Water stress monitoring to identify calamities areas - Water stress monitoring to identify affected crops - Decision Support Tool for yield damage delineation and evaluation Is based on : - Meteorological parameters (Precipitation deficit assessment) - Soil characteristics (Soil moisture deficit assessment) - Crop specificities (Soil moisture deficit threshold) - Phenological development stage (Crop sensitive period)