GCSE Histograms: Understanding and Interpretation

Learn the importance of histograms as a tool for data display and analysis. This course covers how to create and read histograms effectively.
- Uploaded on | 0 Views
-
 austinwalker
About GCSE Histograms: Understanding and Interpretation
PowerPoint presentation about 'GCSE Histograms: Understanding and Interpretation'. This presentation describes the topic on Learn the importance of histograms as a tool for data display and analysis. This course covers how to create and read histograms effectively.. The key topics included in this slideshow are . Download this presentation absolutely free.
Presentation Transcript
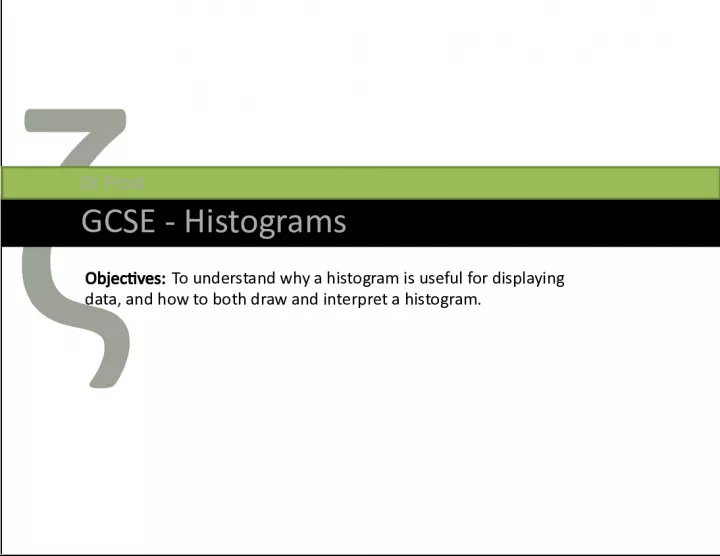
1. GCSE - Histograms Dr Frost Objectives: To understand why a histogram is useful for displaying data, and how to both draw and interpret a histogram.
2. Age (years) Frequency 15 a < 20 15 20 a < 50 15 10 20 30 40 50 Age Frequency 15 Pablo is hosting a party. He counts how many people are between 15 and 20, and 20 and 50. Why is below graph somewhat unhelpful. How could we fix it? Click to Start Bromanimation
3. Age (years) Frequency 15 a < 20 15 20 a < 50 15 10 20 30 40 50 Age Estimated Frequency 3 2 1 Lets presume that within each age group, the ages are evenly spread. Then there would 3 people of each age in the 15-20 group, and 0.5 people of each age in the 20-50 group. Click to Start Bromanimation ? ? Frequency Density The resulting diagram is known as a histogram . The frequency per age is known as the frequency density . In general, given the frequency and class width, we can calculate it using: Frequency Density = Frequency Class Width ?
4. Bar Charts vs Histograms 6 7 8 9 Shoe Size Frequency Height 1.0m 1.2m 1.4m 1.6m 1.8m Frequency Density Bar Charts For discrete data. Frequency given by height of bars. Histograms For continuous data. Data divided into (potentially uneven) intervals. Frequency given by area of bars. ? ? ? ?
5. F.D. Freq Width Copy and complete Weight ( w kg) Frequency Frequency Density 0 < w 10 40 4 10 < w 15 6 1.2 15 < w 35 52 2.6 35 < w 45 10 1 ? ? ? ? 10 20 30 40 50 Height (m) 5 4 3 2 1 Frequency Density Frequency = 15 Frequency = 30 Frequency = 40 Frequency = 25 ? ? ? ?
6. F.D. Freq Width This triangle will help throughout. The Box of Helpfulness We dont know the scale on the frequency density axis. Can we work it out using the first row of the table? 1 2 3 4 5 6 7 8 84 60 ? ? 40 20 = 2 18 30 = 0.6 ? ? 30 30 = 1 ? Frequency Density Start by adding a Frequency Density column 4.2 (using graph) ? 6 (using graph) ?
7. Determining the frequency density scale Frequency Density 0 10 20 Height (m) Frequency 4 3 2 1 ? Copy the diagram and table, then work out the scale on the frequency density axis. Frequency Density 0 10 20 Height (m) Frequency 16 12 8 4 ? Frequency Density 20 28 36 Height (m) Frequency 2 1 ?
8. Exercises Provided collection of past GCSE questions.
9. In pairs, work out the following ?
10. Summary Tips you might give your classmates... Purpose: Histograms allow us to display continuous data grouped into ( potentially non-fixed ) intervals. Area: The area of a bar is equal to the frequency*. * Actually its only proportional to it, but you dont need to worry about that till A Level. Working out the F.D. scale: If the frequency is known and the bar height is known, we can work out the scale using the formula on the left. Frequency Density Formula: Frequency Density is frequency per unit value, i.e: F.D. Freq Width ? ? ? ? Working out proportion of things (no FD scale given): Use any arbitrary scale for FD axis. Use it to find area of region that matches description. Divide by total area. ?