Circle Graphs Interpretation and Design in the News

This article discusses the key terms and concepts involved in interpreting and designing circle graphs, which are commonly used in news reports to convey statistical information. The article covers categories, percentages,
- Uploaded on | 0 Views
-
 adrianfleming
About Circle Graphs Interpretation and Design in the News
PowerPoint presentation about 'Circle Graphs Interpretation and Design in the News'. This presentation describes the topic on This article discusses the key terms and concepts involved in interpreting and designing circle graphs, which are commonly used in news reports to convey statistical information. The article covers categories, percentages,. The key topics included in this slideshow are . Download this presentation absolutely free.
Presentation Transcript
Slide1Circle GraphsInterpretation and Design
Slide2In the News
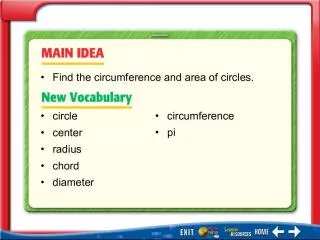
Slide3Key Terms Title Categories Percentages Sectors Total numbers
Slide4Limitations
Slide5Creating Circle GraphsRequired knowledge: - how to draw a circle - angles in a circle (central angle) - calculating percent
Slide6To create a circlegraph: - draw a circle - use a protractor to measure and draw each central angle - label each sector with its category and its percent - colour or shade each sector - add a title for the circle graph
Slide7Key Ideas – Interpreting CircleGraphs A circle graph shows how each category of data compares to the whole using percents. The sum of all percents in a circle graph is 100%. Circle graphs are easier to interpret when there are a smaller number of categories and when the percent values are not too close together.
Slide8Key Ideas: Creating a Circle GraphThe sum of central angles in a circle is 360 degrees. To create a circle graph: - Express each category as a percent of the total. - Use the decimal value of the percent to calculate the measure of the central angle (central angle = decimal value equivalent of percent X 360 degrees). - Use a protractor to measure and draw each central angle. - Add sector labels for the categories and a title to the circle graph.