GIS and Remote Sensing for Water Quality Analysis

This article introduces the use of Geographic Information Systems (GIS) and remote sensing for water quality and environmental analysis. The focus is on exploring how these tools can aid in understanding water resources, pollution and related topics. The author aims to stimulate critical thinking on data analysis methods and environmental systems.
- Uploaded on | 0 Views
-
 porter
About GIS and Remote Sensing for Water Quality Analysis
PowerPoint presentation about 'GIS and Remote Sensing for Water Quality Analysis'. This presentation describes the topic on This article introduces the use of Geographic Information Systems (GIS) and remote sensing for water quality and environmental analysis. The focus is on exploring how these tools can aid in understanding water resources, pollution and related topics. The author aims to stimulate critical thinking on data analysis methods and environmental systems.. The key topics included in this slideshow are GIS, remote sensing, water quality, environmental analysis, interdisciplinary,. Download this presentation absolutely free.
Presentation Transcript
1. Introduction to Geographic Information Systems and Remote Sensing for Water Quality and other environmental analyses AP Environmental Science Mr. Johnston, Fall 2012 Bob Jones High School, Madison, AL Eric R. Anderson M.S. Candidate, Earth System Science Department of Atmospheric Science University of Alabama in Huntsville
2. Introductions Who am I? Who are you? 2
3. My goals Introduce you to GIS, GPS and remote sensing Enable you to explore how these tools can help you understand environmental science Focus on water resources, water pollution, and related topics, while also recognizing the interdisciplinarity of geography and environment Stimulate critical thinking on environmental data, analysis methods and social-ecological systems Help prepare you to get a 5 on your AP test! 3
4. How these modules are organized These GIS modules fit into the water and water pollution topics of your APES class 1. Introduction to GIS & remote sensing (10 Oct) 2. Lab 1 Hands-on intro to GIS tools (11 Oct) 3. GPS Day mapping riparian zones around BJHS campus (12 Oct) 4. Lab 2 Bringing your data into GIS (17 Oct) 5. Lab 3 Remote sensing (18 Oct) 4
5. Today GIS as a tool Key water concepts Water resources/pollution issues at home and abroad The many applications of GIS and remote sensing 5
6. Old Kingdom Egypt First Intermediate Period Stelae Inscriptions (2160-2055 BC) Delta Fayum Nile River Prophecy of Neferti: Dry is the river of Egypt, one crossed the water on foot; one seeks water for ships to sail on, its course having turned into shore land. Ankhtifi of Moalla: All of Upper Egypt was dying of hunger and each individual had reached such a state of hunger that he ate his own children. Ancient humans and their environment
7. Desertification Decline in Northern Africa During Roman times served as granary of the Empire Yielded huge wheat harvests More wheat came into Rome from Egypt and northern Africa than from the Italian peninsula. Ancient humans and their environment
8. Ancient humans and their environment Maya civilization as illustrated in the 1830-40s
9. Ancient humans and their environment el mirador, guatemala 20 felled trees produce only 1 m of lime plaster imagine for an entire city Lime plaster production for Maya architecture
10. Ancient humans and their environment Common thread: ground-level view of their environments
11. 11 A new perspective
12. Camera mounted on V-2 missile launched from White Sands, New Mexico, 1946 12 Some very brief history
13. Canada Geographic Information System (CGIS) 1960s-1970s, Department of Forestry and Rural Development Land use management and resource monitoring 13 Some very brief history
14. M&S Computing (now Intergraph) Corporate HQ in Huntsville, AL Pioneer in computer graphics for engineering applications ERDAS IMAGINE 14 Some very brief history
15. Geographic Information Systems address: Where are features found? What geographical patterns exist? Where have changes occurred over time? Where do certain conditions apply? What happens where if I take a certain action? GIS is: Hardware Software Data People 15 What is GIS?
16. GIS enables: Collecting, managing, analyzing, and displaying data from the real world Understanding, interpretation, visualization of data GIS includes: Global Positioning Systems (GPS) Remote Sensing (RS) 16 What is GIS?
17. Data: representation or symbol of something real Information: data processed to the point of being useful. Answers: Who? What? Where? When? Knowledge: application of data and information. Answers: How? Understanding: analytical, ability to synthesize new knowledge; appreciation of Why? Wisdom : calls various levels of understanding; asks what cannot be answered; process of discerning or judging between right and wrong 17 Data, information, knowledge
18. 18 Data, information, knowledge Data Data Understanding Understanding Connectedness Connectedness Understanding relations Understanding relations Understanding patterns Understanding patterns Understanding principles Understanding principles Information Information Knowledge Knowledge Wisdom Wisdom
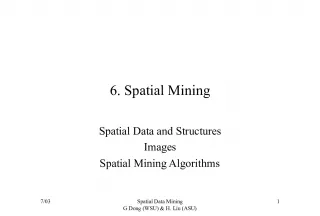
19. Spatial data types Vector Raster 19 Points, lines, polygons (a.k.a. features) Many values or attributes per feature Discrete Grid cells or pixels One value per cell Discrete or continuous The neat/confusing thing is that pretty much anything on Earth (or elsewhere!) can be stored/represented as the data type you decide is most appropriate
20. Give me some examples of things youd like to map or study that could be stored / analyzed as a point, line or polygon Would it be useful to store certain features as points in one case and polygons in another? Lines polygons? Why does this matter? 20 Spatial data types vectors
21. 21 Representing reality in a computer
22. 22 Representing reality in a computer
23. 23 Representing reality in a computer
24. What is continuous data? (vs. discrete) 24 Spatial data types rasters
25. Satellite images water vapor (GOES / NOAA) 25 Spatial data types rasters
26. Satellite data ASTER (NASA/JAXA) 26 Spatial data types rasters
27. Satellite data Bing (WorldView satellite?) 27 Spatial data types rasters
28. What are other kinds of continuous data? 28 Spatial data types rasters
29. What is a watershed? Watershed boundary Drainage network Watershed
30. Watershed its not just hydrology System composed of the interrelationships among social, economic, demographic and biophysical subsystems Unit of measure for planning and evaluation Their management includes natural and human- induced disaster prevention Trejos, Noel 2008. Presentation, Retos y perspectivas del manejo integrado de cuencas hidrogrficas para la mitigacin de impactos del cambio climtico
31. Watersheds serve as boundaries Geophysical and political limits Watershed boundaries Rivers (these change frequently!) Watershed boundary Drainage network Watershed
32. Ro Sixaola floods change international borders ASTER SPOT Analysis in the context of the Regional Visualization and Monitoring System (SERVIR) www.servir.net
33. Fig. 14-3, p. 308 Unconfined Aquifer Recharge Area Precipitation Evaporation and transpiration Evaporation Confined Recharge Area Runoff Flowing artesian well Recharge Unconfined Aquifer Recharge Unconfined Aquifer Stream Well requiring a pump Infiltration Water table Lake Infiltration Unconfined aquifer Confined aquifer Confining impermeable rock layer Confining impermeable rock layer Less permeable material such as clay Less permeable material such as clay
34. 34 Mapping Alabama Groundwater Levels Lee Ellenburg PhD candidate, Environmental Engineering UAHuntsville Earth System Science Center
35. GIS Data Manipulation Took only data from 1982 to present Dissolved individual wells 350 wells 13290 Observations Averaged yearly and seasonal depths
36. Aquifer Determination 36 Determined pressure head from drilled depth and water depth Interpolated differences into raster by the Inverse Distance Weighted Algorithm
37. 37 Used Kriging Spatial statistical model that includes autocorrelation Provides some measure of the certainty or accuracy of the predictions
38. Extraction Cost Analysis 38
39. Estimating Agricultural Water Use 39 Normalized Difference Vegetation Index Evaporation
40. Output Products 40
41. Groundwater Pumping in Saudi Arabia (NASA Landsat images,1987 2012) Irrigation systems from the nonrenewable aquifer appear as green dots. Brown dots are dry or fallow fields, possibly indicating locations of wells that have gone dry. acquired February 5, 1987
42. Groundwater Pumping in Saudi Arabia (NASA Landsat images,1987 2012) Irrigation systems from the nonrenewable aquifer appear as green dots. Brown dots are dry or fallow fields, possibly indicating locations of wells that have gone dry. acquired February 24, 1991
43. Groundwater Pumping in Saudi Arabia (NASA Landsat images,1987 2012) Irrigation systems from the nonrenewable aquifer appear as green dots. Brown dots are dry or fallow fields, possibly indicating locations of wells that have gone dry. acquired March 12, 2000
44. Groundwater Pumping in Saudi Arabia (NASA Landsat images,1987 2012) Irrigation systems from the nonrenewable aquifer appear as green dots. Brown dots are dry or fallow fields, possibly indicating locations of wells that have gone dry. acquired January 17, 2012
45. Fig. 14-7, p. 313 Trade-Offs Withdrawing Groundwater Advantages Disadvantages Useful for drinking and irrigation Aquifer depletion from overpumping Available year- round Sinking of land (subsidence) from overpumping Exists almost everywhere Polluted aquifers for decades or centuries Renewable if not overpumped or contaminated Saltwater intrusion into drinking water supplies near coastal areas Reduced water flows into surface waters No evaporation losses Cheaper to extract than most surface waters Increased cost and contamination from deeper wells
46. Water Pollution 46
47. Fig. 21-4, p. 497 8 ppm Biological oxygen demand Dissolved oxygen (ppm) Types of organisms 8 ppm Recovery Zone Septic Zone Decomposition Zone Clean Zone Fish absent, fungi, sludge worms, bacteria (anaerobic) Trash fish (carp, gar, leeches) Clean Normal clean water organisms (Trout, perch, bass, mayfly, stonefly) Normal clean water organisms (Trout, perch, bass, mayfly, stonefly) Clean Zone Trash fish (carp, gar, leeches) Dilution and decay of degradable, oxygen-demanding wastes and heat in a stream. Water Pollution Problems in Streams
48. Cultural Eutrophication Eutrophication : the natural nutrient enrichment of a shallow lake, estuary or slow moving stream, mostly from runoff of plant nutrients from the surrounding land. Cultural eutrophication : human activities accelerate the input of plant nutrients (mostly nitrate- and phosphate-containing effluents) to a lake. 85% of large lakes near major population centers in the U.S. have some degree of cultural eutrophication.
49. 49 Remote sensing identification of Cyanobacterial blooms Africa Flores SERVIR GRA / MS candidate Earth System Science UAHuntsville Dept. of Atmospheric Science
50. 50 This presentation focuses on the advantages that remote sensing represents to map Cyanobacterial blooms Cyanobacterial Blooms Conventional methods Use of remote sensing
51. Cyanobacteria can produce toxins and their blooms affect the aquatic ecosystem 51 Cyanobacterial blooms have negative impacts on human and animal health
52. 52 Traditional methods of cyanobacteria measurement can be costly and require time/personnel
53. However, in situ data is essential to validate satellite-based data 53 It is almost impossible to map large extensions of cyanobacteria blooms using traditional methods
54. In this case, Cyanobacteria Cyanobacteria has Chlorophyll and other pigments that can be detected by remote sensing 54 Remote sensing techniques are based on the optical properties of the elements that are being evaluated
55. Satellite image Satellite-based identification 55 Remote sensing allows us to map large or small extensions of cyanobacterial blooms very easily and even can separate cyanobacteria from other phytoplankton Questions?
56. Lab activities: Well take a look at some geospatial EPA and USGS data on regional and local water quality Can we identify point sources and nonpoint sources on maps? Is it possible to actually take the non out of nonpoint source pollution using GIS? 56 Note on freshwater pollution
57. Ocean Pollution Pollution of coastal waters near heavily populated areas is a serious problem. About 40% of the worlds population lives near on or near the coast.
59. Hydroelectric power, river fragmentation, and flooding Sometimes theyre related 59
60. Fig. 14-13a, p. 317 Provides water for year-round irrigation of cropland Flooded land destroys forests or cropland and displaces people Large losses of water through evaporation Provides water for drinking Downstream cropland and estuaries are deprived of nutrient-rich silt Reservoir is useful for recreation and fishing Risk of failure and devastating downstream flooding Can produce cheap electricity (hydropower) Downstream flooding is reduced Migration and spawning of some fish are disrupted
61. Level of river fragmentation and flow regulation 61
62. Damming the world 62
63. Floods Heavy rainfall, rapid snowmelt, removal of vegetation, and destruction of wetlands cause flooding. Floodplains, which usually include highly productive wetlands, help provide natural flood and erosion control, maintain high water quality, and recharge groundwater. To minimize floods, rivers have been narrowed with levees and walls, and dammed to store water. Lab activity: explore our own floodplains. Where do we lie on the map?
64. Fig. 14-23a, p. 330 Oxygen released by vegetation Diverse ecological habitat Evapotranspiration Trees reduce soil erosion from heavy rain and wind Agricultural land Steady river flow Leaf litter improves soil fertility Tree roots stabilize soil and aid water flow Vegetation releases water slowly and reduces flooding Forested Hillside
65. Fig. 14-23b, p. 330 Tree plantation Roads destabilize hillsides Roads destabilize hillsides Evapotranspiration decreases Ranching accelerates soil erosion by water and wind Winds remove fragile topsoil Agricultural land is flooded and silted up Gullies and landslides Gullies and landslides Heavy rain leaches nutrients from soil and erodes topsoil Silt from erosion blocks rivers and reservoirs and causes flooding downstream Rapid runoff causes flooding After Deforestation
66. 66 Lago Enriquillo, Dominican Republic
67. 67 Lago Enriquillo, Dominican Republic
68. Assignment What laws or regulations does Alabama have with respect to riparian buffer zones? What are your thoughts? Provide your source(s) of information. Email responses to eric.anderson@nsstc.uah.edu before class on Friday. Some rights reserved by Kay Gaensler 68
69. Resources GIS in APES materials http://nsstc.uah.edu/~anderse/gisinapes.html Earth System Science degree at UAHuntsville http://nsstc.uah.edu/ess NASA DEVELOP [paid!] internships http://develop.larc.nasa.gov/ 69