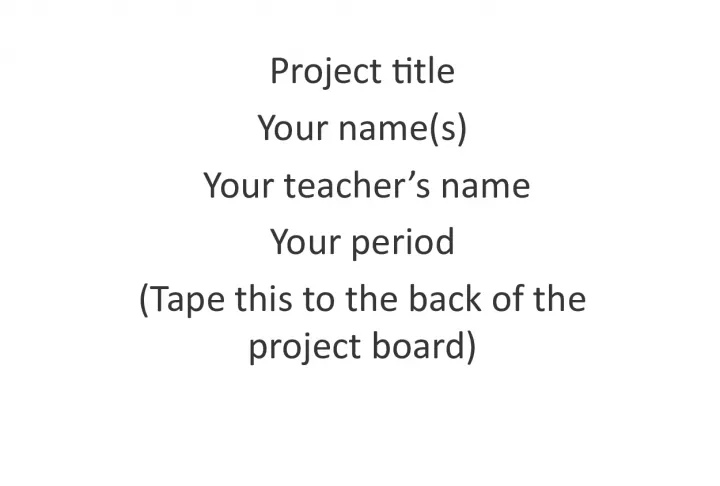
Project titleYour name s Your teacher s name Yo

Project titleYour name s Your teacher s name Your period Tape this to the back of the project board PROJECT TITLEProject Category State the Question Type your question here This is the question that your exp
- Uploaded on | 1 Views
-
 emilythomsen
About Project titleYour name s Your teacher s name Yo
PowerPoint presentation about 'Project titleYour name s Your teacher s name Yo'. This presentation describes the topic on Project titleYour name s Your teacher s name Your period Tape this to the back of the project board PROJECT TITLEProject Category State the Question Type your question here This is the question that your exp. The key topics included in this slideshow are . Download this presentation absolutely free.
Presentation Transcript
Slide1Project titleYour name(s) Your teacher’s name Your period (Tape this to the back of the project board)
Slide2PROJECT TITLEProject Category:
Slide3State the Question• Type your question here. (This is the question that your experiment answers.)
Slide4Abstract• Type a brief overview or summary of your project here.
Slide5Research• Summarize your research here in three to five bullet points: – 1 st point – 2 nd point – 3 rd point – 4 th point – 5 th point
Slide6Variables• Independent variable: The one variable that you purposely change and test. • Dependent variable: The measure of change observed because of the independent variable. It is important to decide how you are going to measure the change. • Controlled variables: These are the things that are kept the same throughout your experiment.
Slide7Hypothesis• If… (Independent Variable) • Then… (Dependent Variable) • Because… (Justification of Independent & Dependent Connection)
Slide8Materials• Item Name Amount (Units) • Type a detailed list of the items you needed to complete your experiments. Be specific about the amounts used.
Slide9Procedures• List all of the steps used in completing your experiment. • Remember to number your steps. • Add photos of your experiments.
Slide10Data Table• It is easier to understand the data if it is put into a table or graph. Create a table in Microsoft Word or Excel, print it and tape it here. • Make sure all data is clearly labeled. • You can also use this website http://nces.ed.gov/nceskids/createagraph/def ault.aspx
Slide11Data Graph• It is easier to understand the data if it is put into a table or graph. Create a graph in Microsoft Excel, print it in color, and attach it here. • Make sure all data is clearly labeled. • You can also use this website http://nces.ed.gov/nceskids/createagraph/def ault.aspx
Slide12Conclusions• Type a brief summary here of what you discovered based on the results of your experiments. • You need to indicate whether or not the data supports the hypothesis and explain why or why not. • Any problems that happened in your experiment that changed your results? • Improvements that could be made if your project goes on to the district Science Fair? • What did you learn or discover that you didn’t know before you started? What connections can you make from your results and your research? Why is it important to your audience?
Slide13APA Bibliography Citations• Be sure to include print and electronic sources and put them in alphabetical order.

