The Economic Burden of Uncorrected Refractive Error

Uncorrected Refractive Error (URE) is the most common cause of visual impairment worldwide and the second most common cause of blindness. This crisis drives individuals and families deeper into poverty and limits opportunities for education and employment, seriously impacting quality of life and productivity. The link between poverty and URE places a heavy economic burden on affected individuals, families, and nations.
- Uploaded on | 0 Views
-
 pranay
About The Economic Burden of Uncorrected Refractive Error
PowerPoint presentation about 'The Economic Burden of Uncorrected Refractive Error'. This presentation describes the topic on Uncorrected Refractive Error (URE) is the most common cause of visual impairment worldwide and the second most common cause of blindness. This crisis drives individuals and families deeper into poverty and limits opportunities for education and employment, seriously impacting quality of life and productivity. The link between poverty and URE places a heavy economic burden on affected individuals, families, and nations.. The key topics included in this slideshow are Refractive Error, Visual Impairment, Blindness, Poverty, Education, Employment,. Download this presentation absolutely free.
Presentation Transcript
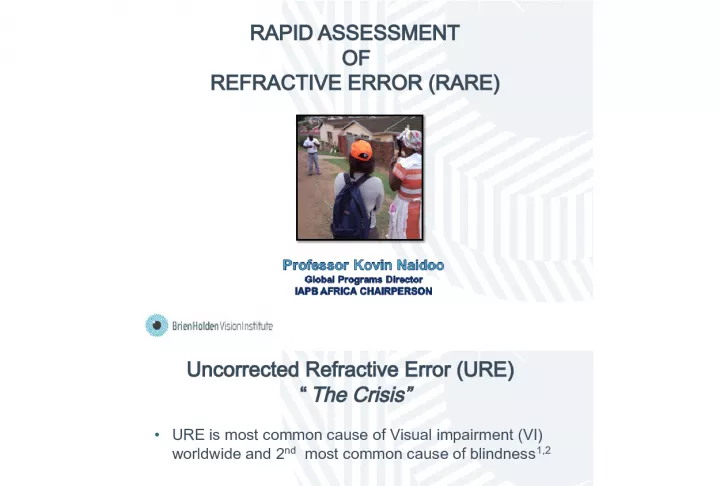
1. RAPID ASSESSMENT OF REFRACTIVE ERROR (RARE)
2. Uncorrected Refractive Error (URE) The Crisis URE is most common cause of Visual impairment (VI) worldwide and 2 nd most common cause of blindness 1,2 URE drives children and adults further into poverty: 3 Limits opportunities to education Employment Seriously impacts quality of life and productivity Link between poverty and VI due to URE places heavy economic burden on individuals families affected nations
3. What is the status of URE? 4 Implications Implications Implications Implications
4. Historical Situation Paucity of Data Refractive data elicited through: RESC studies From community to school Children only Conventional Population based studies Prohibitively expensive High level of expertise Few and far between Lag between completion and Program implementation timelines
5. CONTEXT SETTING Why and where do we need data National level Planning Evaluation Awareness Advocacy Regional level Advocacy Establish priorities for investment in regions
6. RARE Evolved out of RACSS and RAABS
7. How does RARE data help? RARE data can be used in a top-down or bottom-up approach. TOP-DOWN BOTTOM-UP
8. METHODOLOGY
9. Target Group RARE studies used to assess prevalence of URE, presbyopia, spectacle coverage, and barriers to uptake of services for refractive errors and presbyopia 5 Studies are focused on: Younger age groups more affected by RE Presbyopia 15-49 years
10. Definitions Condition Definition Visual Impairment Binocular Presenting VA<6/12 in the better eye Uncorrected Refractive Error (URE) Presenting VA<6/12 but improving 6/12 with pinhole Presbyopia Binocular near vision < N8 at 33-35cms
11. Definition Description URE (Unmet need) Unaided VA <6/12 but improving to 6/12 or better with pinhole and no spectacles Uncorrected Presbyopia (Unmet need) Binocular Unaided near vision
12. Equipment Purpose Snellen chart (E, Alphabet optotypes) Distance Visual Acuity Measuring tape or String Measure testing distance: subject and chart Multiple pinhole occluder Presenting VA, if VA<6/12 N notation chart Near vision Torch light External examination Ready made spectacles (+1.0 to +3.0 Ds) Best corrected near vision assessment in individuals with presbyopia RARE Toolkit
13. OUTPUTS OF RARE STUDIES What is the impact of gathering this information? ....
14. Spectacle Coverage [met need ] . [(met need + unmet need) X 100]
15. Barriers URE 6
16. Current and future RARE studies Studies conducted 1. Eritrea 2. Ghana 3. Uganda 4. South Africa 5. Tanzania Studies in preparation 6. Mozambique 7. Gambia 8. Zambia 9. Cameroon 10. Ethiopia 11. Malawi
17. MAJOR BARRIERS IDENTIFIED IN RARE STUDIES CONDUCTED
18. Comparison of visual impairment and refractive error prevalence across various RARE studies
20. References 1. Resnikoff S, Pascolini D, Mariotti S, Pokharel P. Global magnitude of visual impairment caused by uncorrected refractive errors in 2004. Bull World Health Organ 2008;86:63-70. 2. Holden BA, Fricke T, Ho S, Wong R, Schlenther G, Cronje S, et al. Global vision impairment due to uncorrected presbyopia. Arch Ophthalmol 2008;126:1731-9. 3. Fricke TR, Holden BA, Wilson DA, Schlenther G, Naidoo KS, Resnikoff S and Frick KD. Global cost of correcting vision impairment from uncorrected refractive error. 4. Naidoo KS, Wallace DB, Holden, BA, Minto H, Faal HB, Dube P. The challenge of uncorrected refractive error: driving the agenda of the Durban Declaration on refractive error and service development. Clin Exp Opt 2010: 93(3): 131-136. 5. Marmamula S, Keeffe JE, Rao GN. Uncorrected refractive errors, presbyopia and spectacle coverage: Results from a Rapid Assessment of Refractive Error survey . Ophthalmic Epidemiology 2009;16:269-74. 6. Marmamula et al. Population-based cross-sectional study of barriers to utilisation of refraction services in South India: Rapid Assessment of Refractive Errors (RARE) Study. British Medical Journal .
21. Acknowledgements Pirindha Govender Brien Holden Vision Institute (Public Health Division) Research Department