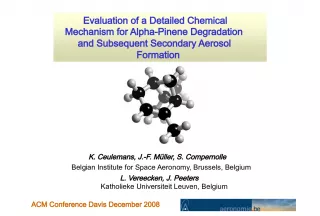
Organic Aerosol from the Oxidation of Biogenic Organic Compounds - A Modelling Study

In this presentation, Promoters Dr. Jean Francois Muller of BIRA-IASB and Prof. Dr. Magda Cl
- Uploaded on | 2 Views
-
 natalia
About Organic Aerosol from the Oxidation of Biogenic Organic Compounds - A Modelling Study
PowerPoint presentation about 'Organic Aerosol from the Oxidation of Biogenic Organic Compounds - A Modelling Study'. This presentation describes the topic on In this presentation, Promoters Dr. Jean Francois Muller of BIRA-IASB and Prof. Dr. Magda Cl. The key topics included in this slideshow are . Download this presentation absolutely free.
Presentation Transcript
Slide1Promoters: Dr. Jean-François Müller (BIRA-IASB) Prof. dr. Magda Claeys (UAntwerpen) Organic aerosol from the oxidation of biogenic organic compounds: a modelling study Karl Ceulemans PhD Defence 13 October 2014
Slide2Organic aerosol from the oxidation of biogenicorganic compounds: a modelling study Outline The atmosphere and volatile organic compounds Organic aerosols: • How formed? • Why of importance? BOREAM Model for biogenic organic aerosol formation Model results: Comparisons with chamber experiments • How well do we model aerosol from α - and β -pinene? • “Ageing” of aerosols For global modelling: Parameterisation 2
Slide3Earth’s atmosphereLayers based on temperature 3 Troposphere : Lowest layer, up to the tropopause (8 km at poles, 15 - 18 km at equator) Temperature decreases with height Strong mixing Stratosphere : Ozone (O 3 ) layer Temperature increases ©The COMET Program
Slide4Earth’s vegetation coverEarth in August 2004, from images of the MODIS satellite (http://earthobservatory.nasa.gov/Features/BlueMarble/) 4
Slide5Biogenic VOC Isoprene (C 5 ) Monoterpenes (C 10 ) • α -pinene • β -pinene Sesquiterpenes (C 15 ) Total: 1000 million tonnes/year Anthropogenic VOC: 185 Mt/y (human CO 2 emissions: 36,000 Mt/y!) 5 500 Mt/y 70 Mt/y 20 Mt/y 7 Mt/y
Slide6Biogenic emissions Stimulated by light and/or temperature Why do plants emit VOCs? Management of drought and heat stress Protection against herbivores 6 • α -pinene • β -pinene Source: http://msue.anr.msu.edu (Bert Cregg)
Slide7What is the fate of volatile organic compounds?React with ozone , OH or NO 3 radicals in air, radical chemistry: Some oxygenated products can condense onto aerosol particles 7 aerosol condensation
Slide8AerosolsSuspensions of microscopic particles in the air 8 Source: Photograph: HAP/Quirky China News / Rex Feat Source:http://math.ucr.edu/home/baez/physics/General/BlueSky/blue_sky.html Source: Sheridan et al. 2005
Slide9Aerosols sizes Size varies between 1 nm to 0.01 mm Can be inhaled and harmful to health 3 million deaths per year (WHO) 9
Slide10Types of aerosols: Mineral aerosols Types of aerosols: Mineral aerosols Dust, volcanoes Dust storm above the Sahara Soot Soot From combustion of fossil fuels or wood Soot seen through electron microscope (source: Müller & Zeitler (2005) Microsc. Microanal.) 10
Slide11Types of aerosols: Secondary aerosols Types of aerosols: Secondary aerosols Formed by condensation of gases Inorganic (no carbon): Sulfate, nitrate aerosol Organic: from oxidation of biogenic or anthropogenic VOCs Source: Adachi and Buseck (2008). Left: Source: Posfai et al. (1999 ). 11
Slide12Influence of aerosols on climate: coolingeffect Direct effect: aerosols reflect light Indirect effect: more and whiter clouds, because aerosols stimulate droplet formation Source: R.J. Griffin, The sources and impacts of tropospheric particulate matter, Nature Education Knowledge, 4, 1, 2013. 12
Slide13Radiative forcing on climate Global warming caused by greenhouse gases CO 2, CH 4, N 2 O Net effect of aerosols is cooling But impact of aerosols on climate is more uncertain Large uncertainty for climate model predictions More research on aerosols needed! Source: IPCC 2013 13
Slide14Ambient measurements of contribution of organic aerosols Ambient measurements of contribution of organic aerosols Source : Zhang et al. (2007) Geoph. Res. Letters 14
Slide15How can we investigate SOA formation?Two compatible approaches: Smog chamber experiments under controlled conditions Modelling of VOC oxidation and aerosol formation A model is a simplified, mathematical representation of complex physical processes, allowing computer simulation We designed and tested a model for α - and β -pinene SOA at BIRA-IASB : BOREAM ( B iogenic hydrocarbon O xidation and RE lated A erosol formation M odel) EUPHORE smog chamber in Valencia Source: http://www-personal.umich.edu/~twalling/ac.html 15
Slide16Advantages and limitations of models Models for aerosol formation might improve simulation of climate change and air quality BUT Myriads of chemical compounds and reactions involved, also physical processes but in most cases: very limited experimental data! SO Model development should be guided/controlled by an existing body of experimental results in smog chambers 16
Slide17BOREAM model: primary gas phase chemistry Ozonolysis of α -pinene: leads to 2 Criegee-intermediates Further chemistry: no direct experimental rate determinations Based on theoretical calculations (Capouet et al., 2008) Contains a large number of fast radical reactions Leads to stable molecules, which react with OH or photolyse 17
Slide18Aerosol model: secondary chemistry18 1000s of products, each can react, form new products, etc. Structure activity relationships (SARs) to predict what happens in absence of experimental data: Automatic generation (GECKO-A model, Aumont et al. 2005) Complete description: would require millions of species! Aumont et al. (2005): number of species in mechanisms generated for n-alkanes + OH
Slide19Aerosol model: Generic chemistry19 To limit number of species in BOREAM. We “lump” less important species with similar structures (same vapour pressure and one similar group) Treat them as one “generic” compound in the model Defined by carbon number, vapour pressure and one explicit functional group We check which secondary reactions are important in current version. For these reactions, products are treated explicitly BOREAM model: ~10,000 compounds and ~90,000 reactions Volatility (corresponding to saturated vapour pressure p vap,im ) of remaining part estimated LX9cONO2
Slide20Modelling of gas/particle partitioningSaturated vapour pressure Activity coefficient Molecular weight organic matter Total absorbing organic aerosol mass 20
Slide21some earlier detailed model studies: underestimates21 Modelling studies based on the Master Chemical Mechanism, (MCM) (Jenkin, 2004, Xia et al., 2008): Find some large model underestimates (up to factor of 1000 compared to the experiment) of SOA yields Reasons: Inadequate vapour pressure estimation Incomplete secondary chemistry, missing condensable products
Slide22BOREAM model: α -pinene dark ozonolysis Majority of yields is modelled within factor of 2 Most overestimates at lower temperatures Most underestimates above 30 °C Song et al.: Oligomerisation reactions can improve model agreement 22 Comparison of modelled vs. experimental yield
Slide23BOREAM model: α -pinene dark ozonolysis Again: Experimental: only minor decrease with temperature Model: strong decrease with temperature In yellow: adding 2.5% of completely condensable product + reduced temp. dependence p vap leads to better agreement 23 Pathak et al. 2007 Yields at 15, 20, 30 and 40 °C
Slide24BOREAM model: α -pinene photo-oxidation Most SOA yields modelled within a factor 2 24 α -pinene oxidised by OH from OH-source (e.g. NO x , H 2 O 2 + light)
Slide25α-pinene SOA composition: gap between experiment and model Model BOREAM model finds negligible yields for these carboxylic acids One reason: low yield of carboxylic acids in bimolecular reactions of acyl peroxys 25 Experiment Main identified tracers: carboxylic acids Terpenylic acid: 1-3%, MBTCA: 1-5% SOA (Kristensen et al., 2014)
Slide26α-pinene SOA composition: gap between experiment and model Models Models predict hydroperoxides to be major SOA species in low NO x 26 Experiment In SOA: almost no hydroperoxide or peroxy acyl nitrate (PAN) species identified Difficulties of current analysis techniques identifying these less stable compounds Example: major compounds BOREAM simulations SOA for experiment E0802 in Yasmeen et al.(2012), CESAM chamber, Paris
Slide27BOREAM model: β -pinene SOA Same conclusions as for α -pinene 27 Photo-oxidation SOA Dark ozonolysis SOA
Slide28Secondary organic aerosol photooxidative ageing Long-term gas phase reaction with OH and photolysis causes this SOA ageing Recent chamber experiments try to achieve atmospheric ageing We check if the model is capable of reproducing them 28 Average lifetime of aerosol in atmosphere: 6 to 10 days Source: Jimenez et al., Science (2009) Smog chamber experiments: a few hours OA in real atmosphere is more oxygenated and lower volatile than OA in most smog chamber exp.
Slide29SOA photooxidative ageing experimentsDark α -pinene ozonolysis followed by UV and OH-ageing 29 First: increase, due to sudden jump in OH adding more oxyg. groups Then: decrease in SOA, probably due to decomposition after photolysis Model: no decrease 100x increase in j -values needed! Exp.: Henry & Donahue, 2012, CMU chamber, US
Slide30SOA photooxidative ageing experiments (2)Dark α -pinene ozonolysis followed by UV and OH-ageing 30 The modelled SOA ageing increase is much higher than observed Modelled O/C ratio increase (from 0.4-0.5 to 0.65-0.75) is much higher than the observed increase Exp.: Tritscher et al., 2011, PSI chamber, Switzerland
Slide31SOA photooxidative ageing experiments (3)α -pinene photo-oxidation and OH-oxidation 31 BOREAM overestimates final M O by between 50 and 100% (at both low, intermediate, and high NO x ) GECKO-A model simulates an even higher SOA concentration Exp.: Ng et al., 2007, Caltech chamber, US Valorso et al., 2011: GECKO-A model low NO x intermediate NO x high NO x
Slide32SOA ageing experiments: wall losses model SOA is overestimated, often by around a factor 2 32 Possible cause: Wall losses underestimated in experiments (Matsunaga & Ziemann, 2010; Donahue et al., 2012); • Normally: gases condense to aerosol until equilibrium • But: gases and particles are deposited on walls • Only particles in air are seen, leading to underestimation of the true aerosol amount!
Slide33Causes SOA ageing overestimation33 Other Possible causes: No radical chemistry in aerosol phase after aerosol phase photolysis Recently: some SOAs become viscous (glassy), prohibiting efficient partitioning Accumulation of uncertainties on kinetic rates
Slide34SOA ageing parametrisation34
Slide35SOA ageing 10-product modelOur approach: Simulations of long-term ageing (12 days) reaching an equilibrium SOA, with α -pinene emissions, SOA formation and deposition Account for dependence on NO x and oxidant (5 scenarios, two products for each), and temperature 35
Slide36Parameterisation performance Reproduces well full BOREAM model under atmospheric conditions from global model IMAGES at 17 locations over 5 months 36
Slide37The parameterisation was applied for monoterpene SOA in the global chemistry transport model IMAGES (in Tsigaridis et al., 2014, Stavrakou et al., 2013) Comparison with ambient OA concentration over US (in Stavrakou et al., 2013): Application in global model 37 Global yearly averaged organic aerosol concentration as simulated by IMAGES
Slide38Conclusions BOREAM generated based on SARs and quantum calculations Majority of SOA yields modelled within factor 2, but • Dark ozonolysis: T -dependence too high • Important observed species not formed in model – most model species remain unidentified in experiments New β -pinene mechanism: reasonable SOA agreement SOA ageing: frequent overestimates of factor 2 or more Parameterisation: for aged SOA, sensitive to T , NO x and oxidant type; good agreement with full model 38
Slide39Acknowledgements:Promoters: Dr. Jean-François Müller (BIRA-IASB) Prof. dr. Magda Claeys (UAntwerpen) Jury: Prof. dr. Annemie Bogaerts (UAntwerpen) Prof. dr. Piet Van Espen (UAntwerpen) Prof. dr. Jean-François Doussin (LISA - UPEC) Prof. dr. Bernard Aumont (LISA - UPEC) I want to acknowledge the contributions, and great amount of help and advice which I received from many other scientists and colleagues: Dr. Steven Compernolle (BIRA-IASB), Prof. dr. Jozef Peeters (KU Leuven), Dr. Luc Vereecken (MPI Mainz), Dr. Thanh Lahm Nguyen (University of Texas), Dr. Ariane Kahnt (UAntwerpen), Dr. Jenny Stavrakou , Dr. Maite Bauwens , and the many other former colleagues at the Belgian Institute for Space Aeronomy (BIRA-IASB) This work would not have been possible without the support of the Belgian Science Policy Office (Belspo) 39 Cover image: Matthias Wassermann
Slide4040
Slide41Additional slides41
Slide42Composition of Earth’s atmosphereMostly nitrogen, oxygen, argon 42 Others • Water vapour (0-4%) • Trace gases: low concentrations: parts per million (ppm), billion (ppb) BUT • Some absorb light • Some very reactive
Slide43Trace gases: Greenhouse gases• CO 2 (400 ppmv) • Methane (1800 ppbv) • N 2 O (324 ppbv) • Greenhouse gases absorb infrared • prevent part of heat radiation to escape to space 43 rise in average temperature
Slide44Trace gases: volatile organic compounds (VOC)Anthropogenic VOC emissions through human activities: traffic, industry, fuel combustion, biomass burning 185 million tonnes per year (about 25 kg per human) Alkanes, alkenes, aromatics, alcohols, ketones, …, … 44
Slide4545α -pinene oxidation by OH
Slide46β-pinene OH oxidation: primary chemistry Based on quantum-chemical calculations Vereecken & Peeters (2012) Previously in MCM: reacts with O 2 In new mechanism: ring-opening (70% - was only 8% in MCM) , leading to complex radical chemistry 46
Slide47β-pinene O 3 oxidation: primary chemistry Based on quantum-chemical calculations Nguyen et al.(2009) 47
Slide48BOREAM: β -pinene photo-oxidation • Carter (2000), β -pinene + NOx + UV- lamps ( ) • MCM-model study Pinho et al. (2007): slight underestimate or good agreement O 3 ( ) • BOREAM standard ( ): overestimates (1 st and 2 nd ), underestimate (3 rd ) • Tests with ring opening fraction • 8% instead of 70% (as in MCM!): O 3 far too high ( ) Current uncertainties prevent very accurate modelling of ozone formation 48 Gas phase: ozone production ETC434 of Carter (2000) ETC435 of Carter (2000) ETC442 of Carter (2000)
Slide49BOREAM: β -pinene photo-oxidation • Hoffmann et al.(1997), β -pinene+NO x + sunlight • Leipzig Aerosol Chamber, β -pinene + H 2 O 2 + UV-lamps, low NO x • BOREAM standard ( ): • good agreement high NO x • slight overestimation low NO x • tests ring opening fraction • 50% instead of 70% ( ) slightly lower SOA • 8% instead of 70% (as in MCM!): far lower SOA( or ) 49 SOA: β -pinene oxidation in high-NO x and low NO x